To evaluate range-mapping and cloaking in a real world operating environment, we conducted extensive measurements in Linux comparing vanilla NFS systems against those with different configurations of range-mapping and cloaking. We implemented range-mapping and file-cloaking in NFSv2 and NFSv3; however, we report the results for NFSv3 only. Our benchmarks for NFSv2 show comparable performance. In this section we discuss the experiments we performed with these configurations to (1) show overall performance on general-purpose workloads, and (2) determine the performance of individual common file operations that are affected the most by this work. Section 4.1 describes the testbed and our experimental setup. Section 4.2 describes the file system workloads we used for our measurements. Sections 4.3 and 4.4 present our experimental results.
We ran our experiments between an unmodified NFS client and an NFS server using five different configurations:
The last three configurations were intended to show the different overheads of our code when each feature is used alone or combined. Since our system runs the same range-mapping or cloaking code with either UIDs or GIDs we evaluated range-mapping and cloaking only for UIDs.
All experiments were conducted between two equivalent Dell OptiPlex model GX110 machines that use a 667MHz Intel Pentium III CPU, 192MB of RAM, and a Maxtor 30768H1 7.5GB IDE disk drive. The two machines were connected to a stand-alone dedicated switched 100Mbps network.
To ensure that our machines were equivalent and our setup was stable, we ran the large-compile Am-utils benchmark (see Section 4.2.1) on both machines, alternating the server and client roles of the two. We compiled the package on the client, using an exported file system from the server. We compared the results and found the difference in elapsed times to be 1.003% and the difference in system time (as measured on the client) to be 1.012%. The standard deviations for these tests ranged from 2.2-2.7% of the mean. Therefore, for the purposes of evaluating our systems, we consider these machines equivalent, but we assume that benchmark differences smaller than 1% may not be significant.
We installed a vanilla Linux 2.4.4 kernel on both machines. We designated one machine as client and installed on this machine an unmodified NFS client-side file system module. On the server we installed both a vanilla NFS server-side file system module and our modified NFS server module that included all of the range-mapping and cloaking code. Since our code exists entirely in the NFS server, we could use a vanilla kernel on the server and simply load and unload the right kNFSd module.
On the server we installed our modified user-level NFS utilities that understand range-mapping and cloaking; these include the exportfs utility and the rpc.nfsd, rpc.lockd, and rpc.mountd daemons. Finally, the server was configured with a dedicated 334MB EXT2FS partition that we used exclusively for exporting to the client machine.
All tests were run with a cold cache on an otherwise quiescent system (no user activity, periodic cron(8) jobs turned off, unnecessary services disabled, etc.). To ensure that we used a cold cache for each test, we unmounted all file systems that participated in the given test after the test completed, and we mounted the file systems again before running the next iteration of the test (including the dedicated server-side exported EXT2FS partition). We also unloaded all NFS-related modules on both client and server before beginning a new test cycle. We verified that unmounting a file system and unloading its module indeed flushes and discards all possible cached information about that file system.
We ran each experiment 20 times and measured the average elapsed, system, and user times. In file system and kernel benchmarks, system times often provide the most accurate representation of behavior. In our tests we measured the times on the NFS client, but the code that was modified ran on the server's kernel. System times reported on a client do not include the CPU time spent by the server's kernel because when the server is working on behalf of the client, the client's user process is blocked waiting for network I/O to complete. I/O wait times are better captured in the elapsed time measurements (or, alternatively, when subtracting system and user times from elapsed times). Since our testbed was dedicated and the network connection fast, we chose to report elapsed times as the better representatives of the actual effort performed by both the client and the server.
Finally, we measured the standard deviations in our experiments and found them to be small: less than 3% for most benchmarks described. We report deviations that exceeded 3% with their relevant benchmarks.
We measured the performance of our system on a variety of file system workloads and with the five different configurations as described in Section 4.1. For our workloads, we used three file system benchmarks: two general-purpose benchmarks for measuring overall file system performance and one micro-benchmark for measuring the performance of common file operations that may be affected by our system.
For these two general benchmarks, we set up the NFS server with the an /etc/exports file configured as follows:
We investigated three additional benchmarks that we did not use to evaluate our work. First, the Modified Andrew Benchmark (MAB) [11] is also a compile-based benchmark but it is too small for modern hardware and completes too quickly as compared to the larger am-utils compile. Second, a newer version of NFSSTONE called NHFSSTONE [7] uses direct RPC calls to a remote NFS server instead of executing system calls on the client because the latter can result in a different mix of actual NFS server operations that are executed. Unfortunately, the only available NHFSSTONE benchmark for Linux [8] supports only NFSv2, whereas we wanted a benchmark that could run on both NFSv2 and NFSv3 servers [2,22,12,17]. Third, the SFS 2.0 benchmark, a successor to LADDIS [24], is a commercial benchmark that provides an industry-standardized performance evaluation of NFS servers (both NFSv2 and NFSv3), but we did not have access to this benchmark [14,23]. Nevertheless, we believe that the benchmarks we did perform represent the performance of our system accurately.
GETATTR: The third benchmark we ran is the primary micro-benchmark we used. Our code affects only file system operations involving accessing and using file attributes such as owner, group, and protection bits. This benchmark runs a repeated set of recursive listing of directories using ls -lR. That way, the micro-benchmark focuses on the operations that are affected the most: getting file attributes and listing them.
Since this benchmark is the one that is affected the most by our code, we ran this test repeatedly with several different configurations aimed at evaluating the performance and scalability of our system. To ensure that the server had the same amount of disk I/O to perform, we used fixed-size directories containing exactly 1000 files each.
To test the scalability, we ran some tests with a different numbers of range-mapped or cloaked entries in /etc/exports: 10, 100, and 1000. Ten entries intends to represent a small site whereas one-thousand entries represents a large site.
For the VAN and MNU tests we used a directory with 1000 zero-length files owned by 1000 different users. These two tests show us the base performance and the effect on performance that including our code has, respectively.
For the RMAP test we also kept the size of the directories being listed constant, but varied the number of UIDs being mapped: 10 mapped users each owning 100 files, 100 mapped users each owning 10 files, and 1000 users each owning one file. The directories were created such that each user's files were listed together so we could also exercise our range-mapping UID cache. The user that ran the ls -lR command for this benchmark on the client was one of the mapped UIDs. (It does not matter which of the mapped users was the one running the test since the entire directory was listed and for each file the server had to check if range-mapping was applicable.) These tests show what effect range-mapping has on performance for different scales of mapping.
For the CLK test we used a similar setup as with range mapping: directories containing 1000 files owned by a different number of cloaked users each time: 10, 100, and 1000. To make the server perform the most work, we ran the benchmark on the client using a user whose UID was not permitted to view any of the files listed. This ensured that the server would process every file in the directory against the user who is trying to list that directory, but would not return any file entries back to the client. This means that although the directory contains 1000 files on the server, the client sees empty directories. This has the effect of reducing network bandwidth and the amount of processing required on the client.
The RMAPCLK test combined the previous two tests, using a different number of range-mapped users all of whom were cloaked: 10, 100, and 1000. The directories included 1000 files owned by a corresponding number of users as were mapped and cloaked. The user we ran the test as, on the client, was one of those users to ensure that the server had to process that user's UID both for mapping and cloaking. This guaranteed that only the files owned by the cloaked user (out of a total of 1000 files) would be returned to the client: 100 files were returned when there were 10 cloaked users, 10 files returned when there were cloaked 100 users, and only one file returned when there were 1000 cloaked users. This test therefore shows the combination of two effects: range-mapping and cloaking make the server work harder, but cloaking also results in reducing the number of files returned to the client, and thus saving on network bandwidth and client-side processing.
Finally, for all benchmarks involving cloaking (CLK and RMAPCLK) we ran the tests with and without the no_client_cache option (Section 3.2), to evaluate the effects of circumventing NFS client-side caching.
Figure 3 shows the results of our am-utils benchmark. This benchmark exercises a wide variety of file operations, but the operations affected the most involve getting the status of files (via stat(2)), something that does not happen frequently during a large compilation; more common are file reads and writes. Therefore the effects of our code on the server are not great in this benchmark, as can be seen from the individual results.
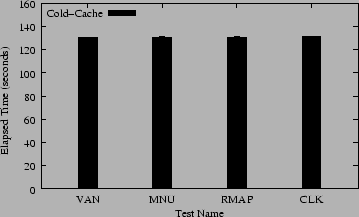 |
When our code is included but not used (MNU vs. VAN) we see a 0.14% degradation in performance. Adding range-mapping (RMAP vs. MNU) costs an additional 0.026% in performance. Adding cloaking (CLK vs. MNU) costs an additional 0.54% in performance. These results suggest that range-mapping and cloaking have a small effect on normal use of NFS mounted file systems.
Figure 4 shows the results of the NFSSTONE benchmark. This benchmark exercises the operations that would be affected by our code on the server (GETATTR) more times than the Am-utils benchmark. Therefore, we see higher performance differences between the individual tests.
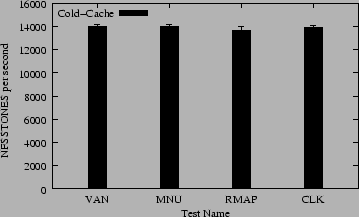 |
When our code is included but not used (MNU vs. VAN) we see a small 0.05% degradation in performance, suggesting that when our code is not used, it has little effect on performance. Adding range-mapping (RMAP vs. MNU) costs an additional 2.5% in performance. Adding cloaking (CLK vs. MNU) costs an additional 0.54% in performance. These results also suggest that range-mapping and cloaking have a small effect on normal use of NFS mounted file systems.
Our code affects operations that get file attributes (stat(2)). The micro-benchmarks tested the effect that our code has on those operations using a variety of server configurations.
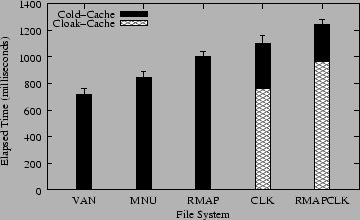 |
Figure 5 shows results of our first micro-benchmark: a recursive listing (ls -lR) we conducted on an NFS-mounted directory containing 1000 entries. The /etc/exports file on the server was configured with range-mapping and cloaking such that the user listing that directory on the client would always see all files. This ensures that the amount of client-side work, network traffic, and server-side disk I/O for accessing the directory remained constant, while making the server's CPU experience different workloads.
The black bars in Figure 5 show the worst-case results, when NFS clients were ignoring their cache: no_client_cache was used on the server, described in Section 3.2. The Cloak-Cache bars show the results when this option was not used, thus allowing clients to use their directory caches.
When our code is included but not used (MNU vs. VAN) we see a 17.6% degradation in performance. This is because each time a client asks to get file attributes, our code must check to see if range-mapping or cloaking are configured for this client. This checking is done by comparing four pointers to NULL. Although these checks are simple, they reside in a critical execution path of the server's code--where file attributes are checked often.
Adding range-mapping (RMAP vs. MNU) costs an additional 18.1% in performance. This time the server scans a linked list of 1000 range-mapping entries for the client, checking to see if the client-side user is mapped or not. Each of 1000 files were owned by a different user and one user was range-mapped. Therefore the server had to scan the entire list of range mappings for each file listed; only one of those files actually got mapped. Such a test ensures that the range-mapping cache we designed was least effective (all cache misses), to show the worst-case overhead.
The cloaking test (CLK vs. MNU) costs an additional 30.3% in performance. This test ensured that the files in the directory were not owned by a cloaked user. Cloaking must guarantee that NFS clients do not use cached file attributes. Therefore the client gets from the server all of the files each time it lists the directory. Moreover, the code that determines if a file should be cloaked or not is more complex as it has to take into account cloak masks. Range-mapping, in comparison, uses a simpler check to see if a UID or GID is in a range of mapped ones; that is why cloaking costs more than range-mapping (10.4% more).
The cumulative overhead of range-mapping and cloaking, when computed as the worst case time difference between cloaking and range-mapping, compared against MNU, is 48.4%. However, when combining cloaking and range-mapping together (RMAPCLK vs. MNU) we see a slightly smaller overhead of 46.9%. This is because the range-mapping and cloaking code is localized in the same NFS server functions. This means that when the NFS server invokes a function look up a file, both range-mapping and cloaking tests are performed without having to invoke that function again, pass arguments to it, etc.
The worst-case situation (RMAPCLK vs. VAN) has an overhead difference of 72.3%. This overhead is for the inclusion of our code and its use on a large directory with 1000 files. Although this overhead is high, it applies only when getting file attributes. Under normal user usage, performance overhead is smaller, as we have seen in Section 4.3.
Finally, for single-user NFS clients, the server can safely allow such hosts to cache directory entries, thus improving performance. The Cloak-Cache results in Figure 5 show what happens when we did not use the no_client_cache export option. For the CLK test, client-side caching improves performance by 30.6%. Client-side caching improves performance of the RMAPCLK test by 22.3%.
The micro-benchmarks in Figure 5 show the worst case performance metrics, when both the server and client have to do as much work as possible. The second set of micro-benchmarks was designed to show the performance of more common situations and how our system scales with the number of range-mapped or cloaked entries used. These are shown in Figure 6.
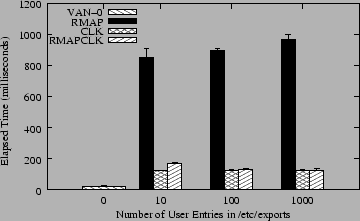 |
The range-mapping bars (RMAP) show the performance of listing directories with 1000 files in them, but varying the number of users that were range-mapped. Range-mapping with 10 users implies that each user owns 100 files. When one of those users lists the directory, that user sees 1000 files, but 100 of those files have their UID mapped by the server. For 100 files and users, only 10 files are mapped; for 1000 files and users, only one file is mapped. The largest cost for range-mapping is the number of range-map entries listed in /etc/exports because the server has to scan the entire (in-memory) list to determine the range-mapping needed for each user that is accessing from the client and for each file that the server wants to present to the client (reverse mapping). Using 100 mappings slows performance by 5.3% compared to 10 mappings; using 1000 mappings costs another 7.9% in performance. Despite two orders of magnitude difference in number of entries used in these three bars, the overall overhead is just 13.6%.
The bars for cloaked configurations (CLK) show a different behavior than range-mapped configurations. Here, all 1000 files were owned by cloaked users, whether there were 10, 100, or 1000 cloaked users. But the user that listed the files on the client was not one of those cloaked users and therefore was not able to see any of those files; what they listed appeared on the client as an empty directory. This test fixes the amount of work that the client has to do (list an empty directory) and the server's work (scan 1000 files and apply cloak rules to each file). This test differs in the number of cloaked user entries listed in /etc/exports. The bars show a small difference in the amount of work that the server had to do to process the cloak lists: 4.1% performance difference between the largest and smallest lists. However, just using the cloaking code costs in performance, even if the client receives no files. We compared this cloaking to listing an empty directory on a vanilla NFS server without cloaking code (marked as VAN-0 in Figure 6); cloaking is 17.8 times slower than listing an empty directory, showing that whereas the client has little work to do, the server must still process a large directory.
Although cloaking consumes more CPU than range-mapping (as seen in Figure 5), the difference between the bars is smaller than with range-mapping and the bars themselves are smaller: 7.3 times faster. The main reason for this is that this cloaking test returns no files back to the client, saving a lot on network bandwidth and client-side CPU processing. This shows on one hand an interesting side effect to cloaking: a reduction in network I/O and client-side processing. On the other hand, to make cloaking work reliably, we had to ensure that the clients would not use cached contents of directories with cloaked files. This potentially increases the amount of network I/O and client-side processing as clients have to scan directories through the server each time they list a directory. We explore these opposing interactions next.
The last set of bars in Figure 6 shows the performance when combining range-mapping with cloaking (RMAPCLK). Since all of the users' files were cloaked and range-mapped, and the user that listed the directory on the client was one of those users, then that user saw a portion of those files (the files they own). With 10 cloaked users, 100 files were seen by the client; with 100 cloaked users, 10 files were seen; and with 1000 cloaked users, only one file was seen. This means that the amount of work performed by the client should decrease as it lists fewer files and has to wait less time for network I/O. The RMAPCLK bars indeed show an improvement in performance as the number of cloaked user entries increases. The reason for this improvement is that the savings in network I/O and client-side processing outweigh the increased processing that the server performs on larger cloak lists. Listing the same directory when we use 100 cloaked and range-mapped entries is 22.3% faster than the directory with 10 entries, because we are saving on listing 90 files. Listing the directory with cloaked 1000 entries is only an additional 4% faster because we are saving on listing just 9 files.
To find out how much cloaking saves on network I/O, we computed an estimate of the I/O wait times by subtracting client-side system and user times from elapsed times. We found that for a combination of cloaking and range-mapping with 10 users, network I/O is reduced by a factor of 4.7. Since cloaking with the no_client_cache option forces clients to ignore cached directory entries, these immediate savings in network I/O would be overturned after the fifth listing of that directory. However, without the no_client_cache option, network I/O savings will continue to accumulate.