Operating System Profiling via Latency Analysis

Nikolai Joukov1, Avishay Traeger1, Rakesh Iyer1, Charles P. Wright1,2, and Erez Zadok1
1Stony Brook University
2IBM T. J. Watson Research Center, Hawthorne

1

Abstract

Operating systems are complex and their behavior depends on many factors. Source code, if available, does not directly help one to understand the OS's behavior, as the behavior depends on actual workloads and external inputs. Runtime profiling is a key technique to prove new concepts, debug problems, and optimize performance. Unfortunately, existing profiling methods are lacking in important areas-they do not provide enough information about the OS's behavior, they require OS modification and therefore are not portable, or they incur high overheads thus perturbing the profiled OS.
We developed OSprof: a versatile, portable, and efficient OS profiling method based on latency distributions analysis. OSprof automatically selects important profiles for subsequent visual analysis. We have demonstrated that a suitable workload can be used to profile virtually any OS component. OSprof is portable because it can intercept operations and measure OS behavior from user-level or from inside the kernel without requiring source code. OSprof has typical CPU time overheads below 4%. In this paper we describe our techniques and demonstrate their usefulness through a series of profiles conducted on Linux, FreeBSD, and Windows, including client/server scenarios. We discovered and investigated a number of interesting interactions, including scheduler behavior, multi-modal I/O distributions, and a previously unknown lock contention, which we fixed.

1  Introduction

Profiling is a standard method to investigate and tune the operation of any complicated software component. Even the execution of one single-threaded user-level program is hardly predictable because of underlying hardware behavior. For example, branch prediction and cache behavior can easily change the program execution time by an order of magnitude. Moreover, there are a variety of possible external input patterns, and processes compete with each other for shared resources in multi-tasking environments. Therefore, only runtime profiling can clarify the actual system behavior even if the source code is available. At first glance, it seems that observing computer software and hardware behavior should not be difficult because it can be instrumented. However, profiling has several contradicting requirements: versatility, portability, and low overheads.
A versatile OS profile should contain information about the interactions between OS components and allow correlation of related information that was captured at different levels of abstraction. For example, a file system operates on files, whereas a hard disk driver operates on data blocks. However, the operation and performance of file systems and drivers depends on their complex interactions; contention on semaphores can change the disk's I/O patterns, while a file system's on-disk format dramatically changes its I/O behavior. This difficulty results in existing OS profiling tools that are hardly portable because they depend on a particular OS and hardware architecture. In addition, profilers for new kernels are often not available because existing profilers have to be ported to each new OS version. To minimize overheads, several hardware components provide profiling help. For example, modern CPUs maintain statistics about their operation [5]. However, only the OS can correlate this information with higher level information, such as the corresponding process. Therefore, some CPU time overheads are inevitable. To minimize these overheads, existing profilers provide limited information, can only profile specific types of activity, and rely on kernel instrumentation.
We developed a gray-box OS profiling method called OSprof. In an OS, requests arrive via system calls and network requests. The latency of these requests contains information about related CPU time, rescheduling, lock and semaphore contentions, and I/O delays. Capturing latency is fast and easy. However, the total latency includes a mix of many latencies contributed by different execution paths and is therefore difficult to analyze. Process preemption complicates this problem further. All existing projects that use latency as a performance metric use some simplistic assumptions applicable only in particular cases. Some authors assume that there is only one source of latency and characterize it using the average latency value [11,12,17,30]. Others use prior knowledge of the latencies' sources to classify the latencies into several groups [3,7,27]. Other past attempts to analyze latencies more generally just look for distribution changes to detect anomalies [9]. Our profiling method allows latency investigation in the general case.
We compile the distributions of latencies for each OS operation, sort them into buckets at runtime, and later process the accumulated results. This allows us to efficiently capture small amounts of data that embody detailed information about many aspects of internal OS behavior. Different OS internal activities create different peaks on the collected distributions. The resulting information can be readily understood in a graphical form, aided by post-processing tools.
We created user-level profilers for POSIX-compliant OSs and kernel-level profilers for Linux and Windows, to profile OS activity for both local and remote computers. These tools have CPU time overheads below 4%. We used these profilers to investigate internal OS behavior under Linux, FreeBSD, and Windows. Under Linux, we discovered and characterized several semaphore and I/O contentions; source code availability allowed us to verify our conclusions and fix the problems. Under Windows, we observed internal lock contentions even without access to source code; we also discovered a number of harmful I/O patterns, including some for networked file systems.
The OSprof method is a general profiling and visualization technique that can be applied to a broad range of problems. Nevertheless, it requires skill to select proper workloads suitable for particular profiling goals. In this paper we describe several ways to select workloads and analyze corresponding profiles.
The rest of this paper is organized as follows. We describe prior work in Section 2. Section 3 describes our profiling method and provides some analysis of its applicability and limitations. Section 4 describes our implementation. We evaluate our system in Section 5. In Section 6 we present several usage scenarios and analyze profiles of several real-world file systems. We conclude in Section 7.

2  Background

The de facto standard of CPU-related code execution profiling is program counter sampling. Unix prof [4] instruments source code at function entry and exit points. An instrumented binary's program counter is sampled at fixed time intervals. The resulting samples are used to construct histograms with the number of individual functions invoked and their average execution times. Gprof [15] additionally records information about the callers of individual functions, which allows it to construct call graphs. Gprof was successfully used for kernel profiling in the 1980s [23]. However, the instrumented kernels had a 20% increase in code size and an execution time overhead of up to 25%. Kernprof [33] uses a combination of PC sampling and kernel hooks to build profiles and call graphs. Kernprof interfaces with the Linux scheduler to measure the amount of time that a kernel function spent sleeping in the profile (e.g., to perform I/O). Unfortunately, Kernprof requires a patch to both the kernel and the compiler, and overheads of 15% were reported. More detailed profiles with granularity as small as a single code line can be collected using tcov [34]. Most modern CPUs contain special hardware counters for use by profilers. The hardware counters allow correlation of profiled code execution, CPU cache states, branch prediction functionality, and ordinary CPU clock counts [5,2]. Counter overflow events generate a non-maskable interrupt, allowing Oprofile [21] to sample events even inside device drivers (with overheads below 8%). Overall, such profilers are less versatile, capturing only CPU-related information.
There are a number of profilers for other aspects of OS behavior such as lock contention [6,26]. They replace the standard lock-related kernel functions with instrumented ones. This instrumentation is costly: Lockmeter adds 20% system time overhead. Other specialized tools can profile memory usage, leaks, and caches [32].
Fewer and less developed tools are available to profile file system performance, which is highly dependent on the workload. Disk operations include mechanical latencies to position the head. The longest operation is seeking, or moving the head from one track to another. Therefore, file systems are designed to avoid seeks [24,29]. Unfortunately, modern hard drives expose little information about the drive's internal data placement. The OS generally assumes that blocks with close logical block numbers are also physically close to each other on the disk. Only the disk drive itself can schedule the requests in an optimal way, and only the disk drive has detailed information about its internal operations. The Linux kernel optionally maintains statistics about the block-device I/O operations and makes those available through the /proc file system, yet little information is reported about timing.
Network packet sniffers capture traffic useful for system and protocol analysis [13]. Their problems are similar to those of hard disk profilers: both the client and server often perform additional processing that is not captured in the trace: searching caches, allocating objects, reordering requests, and more.
Latency contains important information and can be easily collected, but it cannot be easily analyzed because it likely contains a mix of latencies of different execution paths. Several profilers have used a simple assumption that there is one dominant latency contributor that can be characterized by the average latency [1,11,17]. This simple assumption allowed one to profile interrupts even on an idle system [14]. DeBox and LRP investigate average latency changes over time and their correlation with other system parameters [12,30]. Chen and others moved one step further and observed changes in the distribution of latency over time and their correlation with software versions to detect possible problems in network services [9]. Prior knowledge of the underlying I/O characteristics and file system layouts allows categorization of runtime I/O requests based on their latency [3,7,27,28].
There are several methods for integrating profiling into code. The most popular is direct source code modification because it imposes minimal overhead and is usually simple. For example, tracking lock contentions, page faults, or I/O activity usually requires just a few modifications to the kernel source code [6,30]. If, however, every function requires profiling modifications, then a compiler-based approach may be more suitable (e.g., the gcc -p facility). More sophisticated approaches include runtime kernel code instrumentation and layered call interception. Solaris DTrace provides a comprehensive set of places in the kernel available for runtime instrumentation [8]. Dynamic code instrumentation is possible by inserting jump operations directly into the binary [16]. Similarly, debugging registers on modern CPUs can be used to instrument several code addresses at once [10]. Finally, stackable file systems may collect information about file system requests [37].

3  Profiler Design

OSs serve requests from applications whose workloads generate different request patterns. Latencies of OS requests consist of both CPU and wait times:
latency = tcpu + twait
(1)
CPU time includes normal code execution time as well as the time spent waiting on spinlocks:
tcpu = Σ
texec + Σ
tspinlock
Wait time is the time in which a process was not running on the CPU. It includes synchronous I/O time, time spent waiting on semaphores, and time spent waiting for other processes or interrupts that preempted the profiled request:
twait = Σ
tI/O + Σ
tsem + Σ
tint + Σ
tpreempt
tpreempt is the time in which the process was waiting because it ran out of its scheduling quantum and was preempted. We will consider preemption in Section 3.3. We begin by discussing the non-preemptive OS case.
Every pattern of requests corresponds to a set of possible execution paths S. For example, a system call that updates a semaphore-protected data structure can have two paths: (1) if the semaphore is available (latency1 = tcpu1), or (2) if it has to wait on the semaphore (latency2 = tcpu2+tsem).
In turn, each tj is a function with its own distribution. We can generalize that the latencys of paths s S consists of the sum of latencies of their components:
latencys =
Σ
j 
ts,j
(2)
where j is the component, such as I/O of a particular type, program execution-path time, or one of the spinlocks or semaphores.
To find all tj T it is necessary to solve the system of linear Equations 2, which is usually impossible because ||T || ||S || (there are usually fewer paths than time components). Non-linear logarithmic filtering is a common technique used in physics and economics to select only the major sum contributors [22]. We used latency filtering to select the most important latency contributors tmax and filter out the other latency components δ:
log (latency) = log (tmax + δ) log (tmax)
For example, for log2, even if δ is equal to tmax, the result will only change by 1. Most non-trivial workloads can have multiple paths for the same operation (e.g., some requests may wait on a semaphore and some may not). To observe multiple paths concurrently we store logarithms of latencies into buckets. Thus, a bucket b contains the number of requests whose latency satisfies:
b = log2[1/r](latency) r ×log(tmax)
A profile's bucket density is proportional to the resolution r. For efficiency, we always used r = 1. However, r = 2, for example, would double the profile resolution (bucket density) with a negligible increase in CPU overheads and doubled (yet small overall) memory overheads.
data/clone-freebsd.png
Figure 1: A profile of FreeBSD 6.0 clone operations concurrently issued by four user processes on a dual-CPU SMP system. The right peak corresponds to lock contention between the processes. Note: both axes are logarithmic (x-axis is base 2, y-axis is base 10).
Figure 1 shows an actual profile of the FreeBSD 6.0 clone operation called concurrently by four processes on a dual-CPU SMP system. We used CPU cycles as a time metric because it is the most precise and efficient metric available at run-time. For reference, the labels above the profile give the average buckets' latency in seconds. The y-axis shows the number of operations whose latency falls into a given bucket (note that both axes are logarithmic). In Figure 1, the two peaks correspond to two paths of the clone operation: (1) the left peak corresponds to a path without lock contention, and (2) the right peak corresponds to a path with a lock contention. Next, we will discuss how we collect and analyze the captured profiles.

3.1  Profile Collection and Analysis

Let us consider the profile shown in Figure 1 in more detail. We captured this profile entirely from the user level. In addition to the profile shown in Figure 1, we captured another profile (not shown here) with only a single process calling the same clone function; we observed that in that case there was only one (leftmost) peak. Therefore, we can conclude that there is some contention between processes inside of the clone function. In addition, we can derive information about (1) the CPU time necessary to complete a clone request with no contention (average latency in the leftmost peak) and (2) the portion of the clone code that is executed while a semaphore or a lock is acquired (average latency in the leftmost peak times the ratio of elements in the rightmost and leftmost buckets). In general, we use several methods to analyze profiles.
Profile preprocessing  
A complete profile may consist of dozens of profiles of individual operations. For example, a user-mode program usually issues several system calls, so a complete profile consists of several profiles of individual system calls. If the goal of profiling is performance optimization, then we usually start our analysis by selecting a subset of profiles that contribute the most to the total latency. We designed automatic procedures to (1) select profiles with operations that contribute the most to the total latency; and (2) compare two profiles and evaluate their similarity. The latter technique has two applications. First, it can be used to compare all profiles in a complete set of profiles and select only these profiles that are correlated. Second, it is useful to compare two different complete sets of profiles and select only these pairs that differ substantially; this helps developers narrow down the set of OS operations where optimization efforts may be most beneficial. We have adopted several methods from the fields of statistics and visual analytics [31]. We further describe these methods in Section 3.2 and evaluate them in Section 5.3.
Prior knowledge-based analysis  
Many OS operations have characteristic times. For example, we know that on our test machines, a context switch takes approximately 56s, a full stroke disk head seek takes approximately 8ms, a full disk rotation takes approximately 4ms, the network latency between our test machines is about 112s, and the scheduling quantum is about 58ms. Therefore, if some of the profiles have peaks close to these times, then we can hypothesize right away that they are related to the corresponding OS activity. For any test setup, these and many other characteristic times can be measured in advance by profiling simple workloads that are known to show peaks corresponding to these times. It is common that some peaks analyzed for one workload in one of the OS configurations can be recognized later on new profiles captured under other circumstances.
Differential profile analysis  
While analyzing profiles, one usually makes a hypothesis about a potential reason for a peak and tries to verify it by capturing a different profile under different conditions. For example, a lock contention should disappear if the workload is generated by a single process. The same technique of comparing profiles captured under modified conditions (including OS code or configuration changes) can be used if no hypothesis can be made. However, this usually requires exploring and comparing more sets of profiles. As we have already described in this section, we have designed procedures to compare two different sets of profiles automatically and select only those that differ substantially. Section 3.2 discusses these profiles, comparing procedures in more detail.
Layered profiling  
figures/blackbox.png
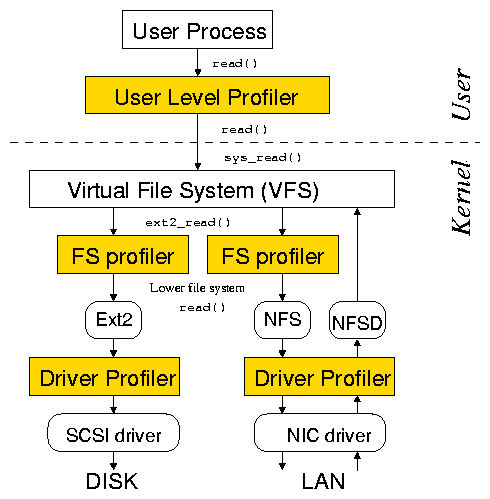
Figure 2: Our infrastructure allows profiling at the user, file system, and driver levels.
It is usually possible to insert latency-profiling layers inside the OS. Most kernels provide extension mechanisms that allow for the interception and capture of information about internal requests. Figure 2 shows such an infrastructure. The inserted layers directly profile requests that are not coming from the user level (e.g., network requests). Comparison of the profiles captured at different levels can make the identification of peaks easier and the measurements more precise. For example, the comparison of user-level and file-system-level profiles helps isolate VFS behavior from the behavior of lower file systems. Note that we do not have to instrument every OS component. For example, we will show later in this section that we can use file system instrumentation to profile scheduler or timer interrupt processing. Unlike specialized profilers, OSprof does not require instrumentation mechanisms to be provided by an OS, but can use them if they are available.
Layered profiling can be extended even to the granularity of a single function call. This way, one can capture profiles for many functions even if these functions call each other. To do so, one may instrument function entry and return points manually-for example, using the gcc -p facility. Similarly, many file system operations call each other. For example, the readdir operation of Linux 2.6 Ext2 calls the readpage operation if directory information is not found in the cache. Therefore, file-system-level profiling can also be considered to be a kind of layered profiling.
Profile sampling  
OSprof is capable of taking successive snapshots by using new sets of buckets to capture latency at predefined time intervals. In this case we are also comparing one set of profiles against another, as they progress in time. This type of three-dimensional profiling is useful when observing periodic interactions or analyzing profiles generated by non-monotonic workload generators (e.g., a program compilation).
Direct profile and value correlation  
If layered profiling is used, it is possible to correlate peaks on the profiles directly with the internal OS state. To do this, we first capture our standard latency profiles. Next, we sort OS requests based on the peak they belong to, according to their measured latency. We then store logarithmic profiles of internal OS parameters in separate profiles for separate peaks. In many cases, this allows us to correlate the values of internal OS variables directly with the different peaks, thus helping to explain them.
We will illustrate all of the above profile analysis methods in Section 6.

3.2  Automated Profile Analysis

We developed an automated profile analysis tool which (1) sorts individual profiles of a complete profile according to their total latencies; (2) compares two profiles and calculates their degree of similarity; and (3) performs these steps on two complete sets of profiles to automatically select a small set of "interesting" profiles for manual analysis.
The third step reflects our experience with using OSprof. It operates in three phases. First, it ignores any profile pairs that have very similar total latencies, or where the total latency or number of operations is very small when compared to the rest of the profiles (the threshold is configurable). This step alone greatly reduces the number of profiles a person would need to analyze. In the second phase, our tool examines the changes between bins to identify individual peaks, and reports differences in the number of peaks and their locations. Third, we use one of several methods to rate the difference between the profiles.
Comparing two profiles   There are several methods for comparing histograms where only bins with the same index are matched. Some examples are the chi-squared test, the Minkowski form distance [35], histogram intersection, and the Kullback-Leibler/Jeffrey divergence [20]. The drawback of these algorithms is that their results do not take factors such as distance into account because they report the differences between individual bins rather than looking at the overall picture.
The Earth Mover's Distance (EMD) is a cross-bin algorithm and is commonly used in data visualization as a goodness-of-fit test [31]. The idea is to view one histogram as a mass of earth, and the other as holes in the ground (the histograms are normalized so that we have exactly enough earth to fill the holes). The EMD value is the least amount of work needed to fill the holes with earth, where a unit of work is moving one unit by one bin. This algorithm does not suffer from the problems associated with the bin-by-bin and other cross-bin comparison methods, and is specifically designed for visualization. It indeed outperformed the other algorithms.
We also used two simple comparison methods: the normalized difference of total operations and of total latency. The algorithms are evaluated in Section 5.3.

3.3  Multi-Process Profiles

Capturing latency is simple and fast. However, early code-profiling tools rejected latency as a performance metric, because in multitasking OSs a program can be rescheduled at an arbitrary point in time, perturbing the results. We show here that rescheduling can reveal information about internal OS components such as the CPU scheduler, I/O scheduler, hardware interrupts, and periodic OS processes. Also, we will show conditions in which their influence on profiles can be ignored.
Forcible preemption effects  
Execution in the kernel is different from execution in user space. Requests executed in the kernel usually perform limited amounts of computation. Some kernels (e.g., Linux 2.4 and FreeBSD 5.2) are non-preemptive and therefore a process cannot be rescheduled (though it can voluntarily yield the CPU, say, during an I/O operation or while waiting on a semaphore). Let us consider a fully preemptive kernel where a process can be rescheduled at any point in time. A process can be preempted during the profiled time interval only during its tcpu component. Let Q be the quantum of time that a process is allowed to run by the scheduler before it is preempted. A process is never forcibly preempted if it explicitly yields the CPU before running for the duration of Q. This is the case in most of the practical scenarios that involve I/O or waiting on semaphores (i.e., yielding the CPU). Let Y be the probability that a process yields during a request. The probability that a process does not yield the CPU during Q cycles is (1-Y) ([Q/(tperiod)]) , where tperiod is the average sum of user and system CPU times between requests. If during Q cycles the process does not yield the CPU, then it will be preempted within the profiled time interval with probability [(tcpu)/(tperiod)]. Thus, the probability that a process is forcibly preempted while being profiled is:
Pr(fp) = tcpu

tperiod
×(1-Y)([Q/(tperiod)])
(3)
Differential analysis of Equation 3 shows that the function rapidly declines if tperiod << QY. Plugging in our typical case numbers for times and 1% yield rate (Y=0.01, tcpu=[(tperiod)/2]=210, Q=226) we get an extremely small forced preemption probability: 2.3 ×10-280.
data/ext2-preempt.png
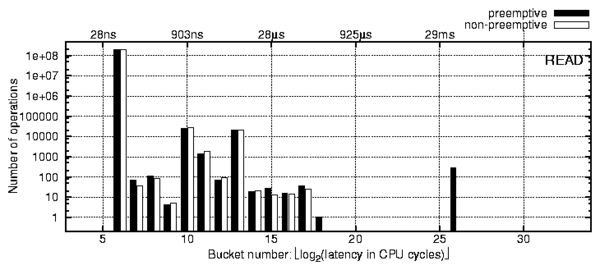
Figure 3: Profile of a read operation that reads zero bytes of data on a Linux 2.6.11 kernel compiled with in-kernel preemption enabled and the same kernel with preemption disabled.
Figure 3 shows two profiles of read operation issued by two processes that were reading zero bytes of data from a file under Linux 2.6.11. One of the profiles was captured on a Linux kernel compiled with in-kernel preemption enabled (black bars) and the other one is captured with the kernel compiled with in-kernel preemption disabled (white bars). For easier comparison, both profiles are shown together. This workload has Y=0 and therefore can produce measurable preemption effects if we generate a large enough number of requests. We had to generate 2 ×10⁸ requests to observe only 278 preempted requests in the 26th bucket. This is consistent with our theory: the average latency of bucket b is equal to tcpu=[3/2]2b, and the expected number of preempted requests from bucket b is nb[(tcpu)/Q] = nb[([3/2]2b)/Q], where nb is the number of elements in bucket b. Summing up the expected number of preempted requests, we calculated that the expected number of elements in the 26th bucket is 388±33% for Linux. We have also verified our theory for Windows XP and FreeBSD 6.0 on uniprocessor and SMP systems. We conclude that preemption effects can be ignored for all the profiles presented in this paper.
Profiles that contain a large number of requests also show information about low-frequency events (e.g., hardware interrupts or background OS threads) even if these events perform a minimal amount of activity. Several small peaks in Figure 3 correspond to such activity. For example, on Linux the total duration of the profiling process divided by the number of elements in bucket 13 is equal to 4ms, which suggests that this peak corresponds to timer interrupt processing. Higher-resolution profiles may help analyze these peaks.
Wait times at high CPU loads  
We normally assume that twait is defined by particular events such as I/O or a wait on a semaphore. However, if the CPU is still busy servicing another process after the twait time, then the request's latency will be longer than the original latency in Equation 1. Such a profile will still be correct because it will contain information about the affected twait. However, it will be harder to analyze as it will be shifted to the right; because the buckets are logarithmic, multiple peaks can become indistinguishable. Fortunately, this can happen only if the sum of the CPU times of all other processes is greater than twait.

3.4  Multi-CPU Profiles

There are two things one should keep in mind while profiling multi-CPU systems.
Clock Skew   CPU clock counters on different CPUs are usually not precisely synchronized. Therefore, the counters difference will be added to the measured latency if a process is preempted and rescheduled to a different CPU. Our logarithmic filtering produces profiles that are insensitive to counter differences that are less than the scheduling time. Fortunately, most systems have small counter differences after they are powered up ( 20ns). Also, it is possible to synchronize the counters in software by writing to them concurrently. For example, Linux synchronizes CPU clock counters at boot time and achieves timing synchronization of 130ns.
Profile Locking   Bucket increment operations are not atomic by default on most CPU architectures. This means that if two threads attempt to update the same bucket concurrently only one of them will succeed. A naïve solution would be to use atomic memory updates (the lock prefix on i386). Unfortunately, this can seriously affect profiler performance. Therefore, we adopted two alternative solutions based on the number of CPUs: (1) If the number of CPUs is small, the probability that two or more bucket writes happen at the same time is small. Therefore, the number of missed profile updates is small. For example, in the worst case scenario for a dual-CPU system, we observed that less than 1% of bucket updates were lost while two threads were concurrently measuring latency of an empty function and updating the same bucket. For real workloads this number is much smaller because the profiler updates different buckets and the update frequency is smaller. Therefore, we use no locking on systems with few CPUs. (2) The probability of concurrent updates grows rapidly as the number of CPUs increases. On systems with many CPUs we make each process or thread update its own profile in memory. This prevents lost updates on systems with any number of CPUs.

3.5  Method Summary

Our profiling method reveals useful information about many aspects of internal OS behavior. In general, profilers can be used to investigate known performance problems that are seen in benchmarks or during normal use, or to actively search for bottlenecks. We have used our profiler successfully in both ways.
When searching for potential performance issues, we found that a custom workload is useful to generate a profile that highlights an interesting behavior. In general, we start with simple workloads and devise more specific, focused workloads as the need arises. Workload selection is a repetitive-refinement visualization process, but we found that a small number of profiles tended to be enough to reveal highly useful information. We derived several formulas that allowed us to estimate the effects of preemption. We showed that for typical workloads (moderate CPU use and small number of system calls) preemption effects are negligible. Conversely, a different class of workloads (lots of CPU time and a large number of system calls) can expose preemption effects. This is useful when deriving the characteristics of internal OS components such as the CPU scheduler, I/O scheduler, and background interrupts and processes. Such information cannot be easily collected using other methods. While creating the workloads, one should keep in mind that workloads generated by many active processes can have high CPU loads and right-shift the latency peaks associated with I/O or semaphore activity. Fortunately, we found that just a few processes can already reveal most process-contention scenarios.
We do not require source code access, which enables us to perform gray-box profiling. The resulting profiles show which process or operation causes contention with another operation. For example, the profiles do not show which particular lock or semaphore is causing a slow-down, because that information is specific to a particular OS and therefore conflicts with our portability goal. Fortunately, the level of detail one can extract with the OSprof profiles is sufficient in most cases. For example, as we show in Section 6, the information we get is sufficient to find out which particular semaphore or lock is problematic if the source code is available. However, if the source code is not available one can still glean many details about a particular lock contention-enough to optimize an OS component or application that does not use the related lock directly.
When profiling from outside the kernel, OSprof does not add overheads to the kernel, and therefore has minimal impact on the OS's internal behavior. Moreover, OSprof traces requests at the interface level and adds small CPU-time overheads only on a per-request basis-without adding any overhead for each internal event being profiled (e.g., taking a semaphore).

4  Implementation

We designed a fast and portable aggregate_stats library that sorts and stores latency statistics in logarithmic buckets. Using that library, we created user-level, file-system-level, and driver-level profilers for Linux, FreeBSD, and Windows, as shown in Figure 2.
Instrumenting Linux 2.6.11 and FreeBSD 6.0 allowed us to verify some of the results by examining the source code. Instrumenting Windows XP allowed us to observe its internal behavior, which is not otherwise possible without access to the source code. We chose source code instrumentation techniques for Linux and FreeBSD for performance and portability reasons. We chose plug-in or binary rewriting instrumentation for the Windows profilers because source code is not currently available.
The aggregate_stats library  
This C library provides routines to allocate and free statistics buffers, store request start times in context variables, calculate request latencies, and store them in the appropriate bucket. We use the CPU cycle counter (TSC on x86) to measure time because it has a resolution of tens of nanoseconds, and querying it uses a single instruction. The TSC register is 64 bit wide and can count for a century without overflowing even for modern CPUs. To be consistent, we store all time values in terms of CPU cycles.
POSIX user-level profilers  
We designed our user-level profilers with portability in mind. We directly instrumented the source code of several programs used to generate test workloads in such a way that system calls are replaced with macros that call our library functions to retrieve the value of the CPU timer, execute the system call, and then calculate the latency and store it in the appropriate bucket. This way, the same programs can be recompiled for other POSIX-compliant OSs and be used for profiling immediately. Upon exit, the program prints the collected profiles to the standard output.
Windows user-level profilers  
To profile Windows under workloads generated by arbitrary non-open-sourced programs, we created a runtime system-call profiler. It is implemented as a DLL and uses the Detours library [16] to insert instrumentation functions for each system call of interest. Detours can insert new instrumentation into arbitrary Win32 functions even during program execution. It implements this by rewriting the target function images. To produce a workload, we ran a program that executes the test application and injects the system call profiler DLL into the test program's address space. On initialization, the profiler inserts instrumentation functions for the appropriate Windows system calls.
Linux and FreeBSD file-system-level profilers   We chose source code instrumentation to insert latency measurement code into existing Linux and FreeBSD file systems because it is simple and adds minimal profiling overheads. We implemented the profiling code as a FiST [37] file system extension. Our automatic code instrumentation system, FoSgen [18], parses this extension and applies it to file systems. It performs four steps: (1) Scan all source files for VFS operation vectors. (2) Scan all source files for operations found in the previous step and insert latency calculation macros in the function body; this also replaces calls to outside functions with wrappers. (3) Include a header file to declare the latency calculation macros in every C file that needs them. (4) Create aggregate_stats and /proc interface source files and add them to the Makefile.
FoSgen assumes that the file system's VFS operations are defined within fixed operation vectors. In particular, every VFS operation is a member of one of several data structures (e.g., struct inode_operations). These data structures contain a list of operations and hard-coded associated functions. For example, Figure 4 shows the definition of Ext2's file operations for directories. FoSgen discovers implementations of all file system operations and inserts FSPROF_PRE(op) and FSPROF_POST(op) macros at their entry and return points. For non-void functions of type f_type, FoSgen transforms statements of the form return foo(x) to:
{
   f_type tmp_return_variable = foo(x);
   FSPROF_POST(op);
   return tmp_return_variable;
}

struct file_operations ext2_dir_operations = {
   read:      generic_read_dir,
   readdir:   ext2_readdir,
   ioctl:     ext2_ioctl,
   fsync:     ext2_sync_file,
}; 
Figure 4: Ext2 directory operations. The kernel exports the generic_read_dir function for use by many file systems.
Often, file systems use generic functions exported by the kernel. For example, Ext2 uses the generic_read_dir kernel function for its read operation, as shown in Figure 4. FoSgen creates wrapper functions for such operations and instruments them to measure the latency of external functions.
FoSgen consists of 607 lines of perl code. Despite its simplicity, it successfully instrumented more than a dozen Linux 2.4.24, 2.6.11, and FreeBSD 6.0 file systems we tried it on. Also, FoSgen instrumented nullfs and Wrapfs [37]-stackable file systems that can be mounted on top of other file systems to collect their latency profiles.
In addition to FoSgen, we have also created a simpler bash and sed script that can instrument Linux 2.4 and 2.6 file systems. The shell script contains 307 lines and 184 distinct sed expressions.
Windows file-system-level profilers  
The Windows kernel-mode profiler is implemented as a file system filter driver [25] that stacks on top of local or remote file systems. In Windows, an OS component called the I/O Manager defines a standard framework for all drivers that handle I/O. The majority of I/O requests to file systems are represented by a structure called the I/O Request Packet (IRP) that is received via entry points provided by the file system. The type of an I/O request is identified by two IRP fields: MajorFunction and MinorFunction. In certain cases, such as when accessing cached data, the overhead associated with creating an IRP dominates the cost of the entire operation, so Windows supports an alternative mechanism called Fast I/O to bypass intermediate layers. Our file system profiler intercepts all IRPs and Fast I/O traffic that is destined to local or remote file systems.
Driver-level profilers  
In Linux, file system writes and asynchronous I/O requests return immediately after scheduling the I/O request. Therefore, their latency contains no information about the associated I/O times. To detect this information, we instrumented a SCSI device driver; to do so we added four calls to the aggregate_stats library. Windows provides a way to create stackable device drivers, but we did not create one because the file system layer profiler already captures latencies of writes and asynchronous requests.
Representing results   We wrote several scripts to generate formatted text views and Gnuplot scripts to produce 2D and 3D plots. All the figures representing profiles in this paper were generated automatically. In addition, these scripts check the profiles for consistency. aggregate_stats maintains checksums of the number of time measurements. For every operation, results in all of the buckets are summed and then compared with the checksums. This verification catches potential code instrumentation errors.
Portability  
Each of our instrumentation systems consists of three parts: (1) the aggregate statistics library, which is common to all instrumentation systems; (2) the instrumentation hooks; and (3) a reporting infrastructure to retrieve buckets and counts. Our aggregate statistics library is 141 lines of C code, and only the instruction to read the CPU cycle counter is architecture-specific. In the Linux kernel, we used the /proc interface for reporting results, which consists of 163 lines. The instrumentation hooks for our Linux device driver used 10 lines. For user-space on Unix, our instrumentation and reporting interface used 68 lines.
Our Windows filter driver was based on FileMon [36] and totaled 5,262 lines, of which 273 were our own C code and 63 were string constants. We also wrote a 229-line user application to retrieve the profile from the kernel. We used the Detours library [16] for the Windows user-space profiling tool. We added 457 lines of C code to intercept 112 functions, of which 337 lines are repetitive pre-operation and post-operation hooks.
In sum, our profiling system is fairly portable, with less than 1,000 lines of code written for each of the three OSs. The aggregate statistics library runs without changes in four different environments: Unix applications, Windows applications, and the Unix and Windows kernels. We developed an automatic instrumentation tool for Linux and FreeBSD file systems that could be easily adapted for other Unix file systems.

5  Evaluation

We evaluated the overhead of our profiler using an instrumented Linux 2.6.11 Ext2 file system. We measured memory usage, CPU cache usage, the latency added to each profiled operation, and the overall execution time. We chose to instrument a file system, instead of a program, because a file system receives a larger number of requests (due to the VFS calling multiple operations for some system calls) and this demonstrates higher overheads. Moreover, user-level profilers primarily add overheads to user time. We conducted all our experiments on a 1.7GHz Pentium 4 machine with 256KB of CPU cache and 1GB of RAM. It uses an IDE system disk, but the benchmarks ran on a dedicated Maxtor Atlas 15,000 RPM 18.4GB Ultra320 SCSI disk with an Adaptec 29160 SCSI controller. We unmounted and remounted all tested file systems before each benchmark run. We also ran a program we wrote called chill that forces the OS to evict unused objects from its caches by allocating and dirtying as much memory as possible. We ran each test at least ten times and used the Student-t distribution to compute the 95% confidence intervals for the mean elapsed, system, user, and wait times. Wait time is the elapsed time less CPU time and consists mostly of I/O, but process scheduling can also affect it. In each case, the half-widths of the confidence intervals were less than 5% of the mean.

5.1  Memory Usage and Caches

We evaluated the memory and CPU cache overheads of the file system profiler. The memory overhead consists of three parts. First, there is some fixed overhead for the aggregation functions. The initialization functions are seldom used, so the only functions that affect caches are the instrumentation and sorting functions which use 231 bytes. This is below 1% of cache size for all modern CPUs. Second, each VFS operation has code added at its entry and exit points. For all of the file systems we tested, the code-size overhead was less than 9KB, which is much smaller than the average memory size of modern computers. The third memory overhead comes from storing profiling results in memory. A profile occupies a fixed memory area. Its size depends on the number of implemented file system operations and is usually less than 1KB.

5.2  CPU Time Overheads

figures/fxn-oh.png
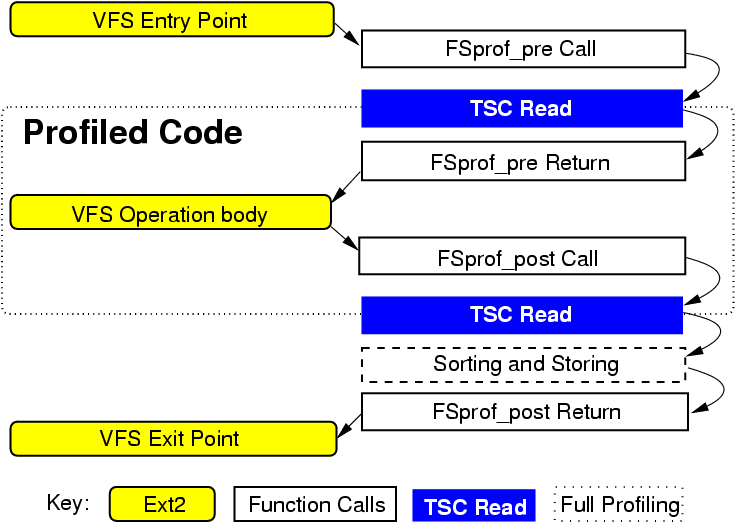
Figure 5: Profiled function components.
To measure the CPU-time overheads, we ran Postmark v1.5 [19] on an unmodified and on an instrumented Ext2. Postmark simulates the operation of electronic mail servers. It performs a series of file system operations such as create, delete, append, and read. We configured Postmark to use the default parameters, but we increased the defaults to 20,000 files and 200,000 transactions so that the working set is larger then OS caches and so that I/O requests will reach the disk. This configuration runs long enough to reach a steady-state and it sufficiently stresses the system. Overall, the benchmarks showed that wait and user times are not affected by the added code. The unmodified Ext2 used 18.3 seconds of system time, or 16.8% of elapsed time. The instrumentation code increased system time by 0.73 seconds (4.0%). As seen in Figure 5, there are three additional components added: making function calls, reading the TSC register, and storing the results in the correct buckets. To understand the details of this per-operation overheads, we created two additional file systems. The first contains only empty profiling function bodies, to measure the overhead of calling the profiling functions. Here, the system time increase over Ext2 was 0.28 seconds (1.5%). The second file system read the TSC register, but did not include code to sort the information or store it into buckets. Here, the system time increased by 0.36 seconds over Ext2 (2.0%). Therefore, 1.5% of system time overheads were due to calling profiling functions, 0.5% were due to reading the TSC, and 2.0% were due to sorting and storing profile information.
Not all of the overhead is included within the profile results. Only the portion between the TSC register reads is included in the profile, and therefore it defines the minimum value possible to record in the buckets. Assuming that an equal fraction of the TSC is read before and after the operation is counted, the delay between the two reads is approximately equal to half of the overhead imposed by the file system that only reads the TSC register. We computed the average overhead to be 40 cycles per operation. This result is confirmed by the fact that the smallest values we observed in any profile were always in the 5th bucket. The 40-cycle overhead is well below most operation latencies, and can influence only the fastest of VFS operations that perform very little work. For example, sync_page is called to write a dirty page to disk, but it returns immediately if the page is not dirty. In the latter case its latency is at least 80 cycles long.

5.3  Automated Profile Analysis Accuracy

We conducted an informal study to measure the accuracy of our automated analysis tool. Three graduate students with twelve combined years of file system experience and six combined years of experience using OSprof examined over 250 profile pairs to determine which profiles contained important information (those which should be reported by an automated tool). We define a false positive as the tool reporting a profile that we did not consider to be important, and a false negative as the tool failing to report an important profile. We also sorted the same 250 profile pairs using our automated methods described in Section 3.2. The Chi-square method produced 5% of false positives and negatives; the total operation counts method produced 4%; the total latency method-3%; and the Earth Mover's Distance method had the smallest false classification rate of 2%.

6  Example File System Profiles

In this section we describe a few interesting examples that illustrate our method of analyzing OS behavior. We also illustrate our profile analysis methods described in Section 3.1. To conserve space, we concentrate on profiles of disk-based file systems and network file systems. Such profiles tend to contain a wide spectrum of events. We conducted all experiments on the same hardware setup as described in Section 5. Unless noted otherwise, we profiled a vanilla Linux 2.6.11 kernel and Windows XP SP2. All profiles presented in this section are from the file-system level except Figure 10.
We ran two workloads to capture the example profiles: a grep and a random-read on a number of file systems. The grep workload was generated by the grep utility that was recursively reading through all of the files in the Linux 2.6.11 kernel source tree. The random-read workload was generated by two processes that were randomly reading the same file using direct I/O mode. In particular, these processes were changing the file pointer position to a random value and reading 512 bytes of data at that position. Of note is that we did not have to use many workloads to reveal a lot of new and useful information. After capturing just a few profiles, we were able to spot several problematic patterns.

6.1  Analyzing Disk Seeks

data/llseek.png
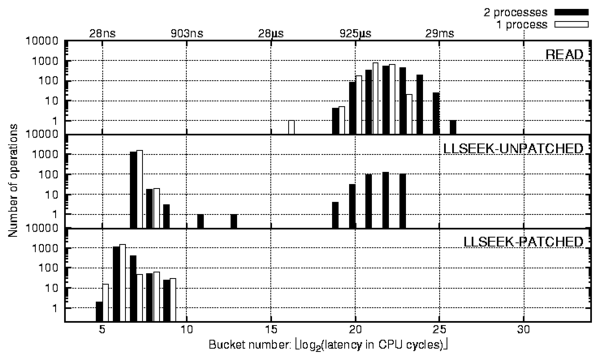
Figure 6: The llseek operation under random reads.
We ran the random-read workload generated by one and two processes. The automated analysis script alerted us to significant discrepancies between the profiles of the llseek operations. As shown in Figure 6, there are three interesting facts about the reported profiles that indicated process contention. First, the behavior did not exist when running with one process. Second, the llseek operation was among the main latency contributors. This was noted as a strange behavior because the operation only updates the current file pointer position stored in the file data structure. Third, the right-most peak was strikingly similar with the read operation. Although these facts indicate that the llseek operation of one process competes with the read operation of the other process, llseek updates a per-process data structure, so we were unsure as to why that would happen.
Upon investigation of the source code, we verified that the delays were indeed caused by the i_sem semaphore in the Linux-provided method generic_file_llseek-a method which is used by most of the Linux file systems including Ext2 and Ext3. We observed that this contention happens 25% of the time, even with just two processes randomly reading the same file. We modified the kernel code to resolve this issue as follows. In particular, we observed that to be consistent with the semantics of other Linux VFS methods, we need only protect directory objects and not file objects. The llseek profile captured on the modified kernel is shown at the bottom of Figure 6. As we can see, our fix reduced the average time of the llseek from 400 cycles to 120 cycles (a 70% reduction). The improvement is compounded by the fact that all semaphore and lock-related operations impose relatively high overheads even without contention, because the semaphore function is called twice and its size is comparable to llseek. Moreover, semaphore and lock accesses require either locking the whole memory bus or at least purging the same cache line from all other processors, which can hurt performance on SMP systems. (We submitted a small patch which fixes this problem and its description to the core Linux file system developers, who agreed with our reasoning and conclusions.)
We ran the same workload on a Windows NTFS file system and found no lock contention. This is because keeping the current file position consistent is left to user-level applications on Windows.

6.2  Analyzing File System Read Patterns

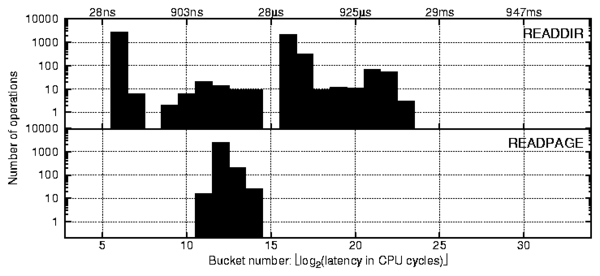
We now show how we analyzed various file system I/O patterns under the grep workload. In this workload, we use the grep utility to search recursively through the Linux kernel sources for a nonexistent string. Most of the peaks shown in the top profile of Figure 7 are common for all file system operations that require hard disk accesses. Here we refer to the readdir operation peaks by their order from left to right: first (buckets 6 and 7), second (9-14), third (16 and 17), and fourth (18-23).
data/ext2-readdir.png
Figure 7: Profiles of Linux 2.6.11 Ext2 readdir (top) and readpage (bottom) operations captured for a single run of grep -r on a Linux source tree.
First peak (buckets 6-7)  
From the profile of Figure 3 we already know that on Linux the peak in the 6th bucket corresponds to a read of zero bytes of data or any other similar operation that returns right away. The readdir function returns directory entries in a buffer beginning from the current position in the directory. This position is automatically updated when reading and modifying the directory and can also be set manually. If the current position is past the end of the directory, readdir returns immediately (this happens when a program repeatedly calls readdir until no more entries are returned). Therefore, it seems likely that the first peak corresponds to the reads past the end of directory. One way to verify our hypothesis would be to profile a workload that issues readdir calls only after there are no more directory entries to read and then compares the resulting profiles (differential analysis). However, we can demonstrate our other method of profile analysis by directly correlating peaks and variables.
To do so, we slightly modified our profiling macros: instead of storing the latency in the buckets we (1) calculated a readdir_past_EOF value for every readdir call (readdir_past_EOF = 1 if the file pointer position is greater or equal to the directory buffer size and is 0 otherwise); (2) if the latency of the current function execution fell within the range of the first peak, a value of the bucket corresponding to readdir_past_EOF ×1,024 was incremented in one profile and in another profile otherwise. The resulting profiles are shown in Figure 8 and prove our hypothesis.
data/ext2-peaks.png
Figure 8: Correlation of the readdir_past_EOF ×1,024 and the requests' peaks in Figure 7.
Second peak (buckets 9-14)  
The readdir operation calls the readpage operation for pages not found in the cache. The readpage profile is a part of the complete grep workload profile and is shown on the bottom in Figure 7. During the complete profile preprocessing phase our automatic profiles analysis tool discovered that the number of elements in the third and fourth peaks is exactly equal to the number of elements in the readpage profile. This immediately suggests that the second peak corresponds to readdir requests that were satisfied from the cache. Note that the latency of readpage requests is small compared to related readdir requests. That is because readpage just initiates the I/O and does not wait for its completion.
Third peak (buckets 16-17)  
The third and the fourth peaks of the readdir operation correspond to disk I/O requests. The third peak corresponds to the fastest I/O requests possible. It does not correspond to I/O requests that are still being read from the disk and thus may require disk rotations or even seeks. This is because the shape of the third peak is sharp (recall that the Y scale is logarithmic). Partially read data requests would have to wait for partial disk rotations and thus would spread to gradually merge with the fourth peak. Therefore, the third peak corresponds to I/O requests satisfied from the disk cache due to internal disk readahead.
Fourth peak (buckets 18-23)  
We know that the fourth peak corresponds to requests that may require seeking with a disk head (track-to-track seek time for our hard drive is 0.3ms; full stroke seek time is 8ms) and waiting for the disk platter to rotate (full disk rotation time is 4ms).

6.3  Reiserfs and Timeline Profiles

On Linux, atime updates are handled by the Linux buffer flushing daemon, bdflush. This daemon writes data out to disk only after a certain amount of time has passed since the buffer was released; the default is thirty seconds for data and five seconds for metadata. This means that every five and thirty seconds, file system behavior may change due to the influence of bdflush. We use our profile sampling method to analyze the behavior of such periodic behavior. A sampled profile is similar to our standard profile, but instead of adding up all of the operations for a given workload, we divide the profile into fixed-time segments and save each segment separately. This mode of operation is possible thanks to the small size of the OSprof profile data. In Figure 9, we show such a 3-dimensional profile of a known lock contention between write_super and read operations on Reiserfs 3.6 on Linux 2.4.24. The x-axis shows the bucket number and the y-axis shows the elapsed time in CPU cycles. The three vertical black stripes on the read profiles correspond to those peaks already shown in Figure 7: cached reads, disk buffer reads, and reads with a disk access.
data/reiser3tail_map.png
Figure 9: Linux 2.4.24 Reiserfs 3.6 file-system profiles sampled at 2.5 second intervals.

6.4  Analyzing Network File Systems

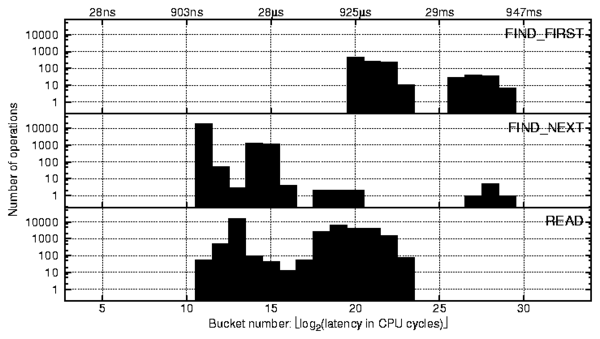
We connected two identical machines (described in Section 5) with a 100Mbps Ethernet link and ran several workloads. The purpose was to compare clients using the Linux implementation of the SMB protocol with those using the Windows implementation of the CIFS protocol (a modified version of SMB). The server ran Windows with an NTFS drive shared over CIFS. Our automated analysis script selected just six out of 51 profiled operations based on their total latency when running our grep workload. Among them, the FindFirst and FindNext operations on the Windows client had peaks that were farther to the right than any other operation (buckets 26-30 in the top two graphs of Figure 10). Layered profile analysis showed that these two peaks were not present in the profiles of the Linux client and alone account for 12% of the elapsed time, which was 170 seconds in total. FindFirst searches for file names with a given pattern and returns all matching file names along with their associated metadata information. It also returns a cookie, which allows the caller to continue receiving matches by passing it to FindNext.
data/cifs.png
Figure 10: FindFirst, FindNext, and read operations on the Windows client over CIFS.
By examining the peaks in other operations on the client (e.g., read shown in Figure 10) and the corresponding requests on the server, we found that instances of an operation which fall into bucket 18 and higher (greater than 168s) involve interaction with the server, whereas buckets to the left of it were local to the client. All of the FindFirst operations here go through the server, as do the rightmost two peaks of the FindNext operation. We ran a packet sniffer on the network to investigate this further.
figures/network.png
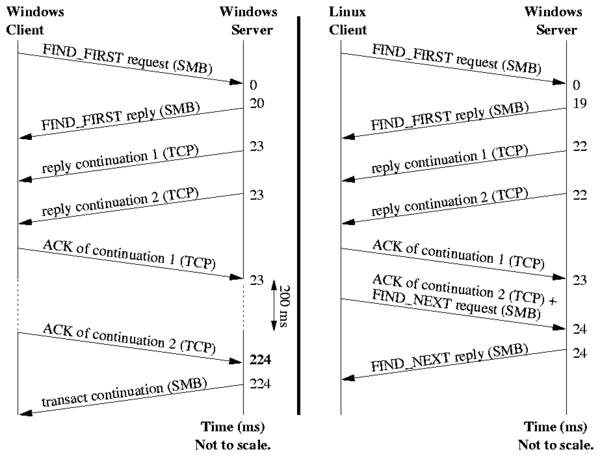
Figure 11: Timelines depicting the transactions involved in the handling of a FindFirst request between a Windows client and server over CIFS (left) and between a Linux client and a Windows server over SMB (right) as recorded on the server. Times are in milliseconds (not drawn to scale). Protocols are shown in parentheses.
A timeline for a typical FindFirst transaction between a Windows client and a Windows server explains the source of the problems and is shown on the left-hand side of Figure 11. The client begins by sending a FindFirst request containing the desired pattern to search for (e.g., C:\linux-2.6.11\*). The server replies with file names that match this pattern and their associated metadata. Since the reply is too large for one TCP packet, it is split into three packets ("FIND_FIRST reply," "reply continuation 1," and "reply continuation 2"). The acknowledgment (ACK) for "reply continuation 1" is sent immediately, but the ACK for "reply continuation 2" is sent only after approximately 200ms. This behavior is a delayed ACK: because TCP can send an ACK in the same packet as other data, it delays the ACK in the hope that it will soon need to send another packet to the same destination. Most implementations wait 200ms for other data to be sent before sending an ACK on its own. Delaying an ACK is considered to be good behavior, but the Windows server does not continue to send data until it has received an ACK for everything until that point. This unnecessary synchronous behavior is what causes poor performance for the FindFirst and FindNext operations. After the server receives this ACK, it sends the client a "transact continuation" SMB packet, indicating that more data is arriving. This is followed by more pairs of TCP replies and ACKs, with similar delays.
The right-hand side of Figure 11 shows a similar timeline for a Linux client interacting with a Windows server over SMB. The behavior is identical, except that instead of sending a delayed ACK for "reply continuation 2," Linux sends a FindNext request immediately that also contains an ACK. This causes the server to return more entries immediately. We modified a Windows registry key to turn off delayed ACKs, and found that it improved elapsed time by 20%. This is not a solution to the problem, but a way to approximate potential performance benefits without waiting on ACKs.

7  Conclusions

We designed a new OS profiling method that is versatile, portable, and efficient. The method allows the person profiling to consider and analyze the OS and the events being profiled at a high level of abstraction. In particular, the events can be anything that contribute to the OS execution latencies. Our method allows profiling various characteristics and behavior of the whole OS, including the I/O subsystem. The resulting profiles indicate pathologies and their dependencies. Access to the source code allows us to investigate these abstract characteristics such as lock or semaphore contentions. However, even without the source code, most of the problems can be described and studied in detail. While versatile, our method allows profiling with very high precision of about 40 CPU cycles and negligible overheads of only about 200 CPU cycles per profiled OS entry point. When run with an I/O-intensive workload, we measured elapsed time overhead of less than 1%.
We used our method to collect and analyze profiles for task schedulers, CPU-bound processes, and several popular Linux, FreeBSD, and Windows file systems (Ext2, Ext3, Reiserfs, NTFS, and CIFS). To aid this analysis, we developed automatic processing and visualization scripts to present the results clearly and concisely. We discovered, investigated, and explained multi-modal latency distributions. We also identified pathological performance problems related to lock contention, network protocol inconsistency, and I/O interference.
Future work  
We plan to apply our methods to more OSs and use higher resolution profiles to explain more complex internal OS behavior. Because of the compactness of our profiles, we believe that OSprof is suitable for clusters and distributed systems. We plan to expand OSprof for use on such large systems, explore scalability issues, and visual analytics driven profile automation.
Acknowledgments   We thank the anonymous program committee members and our shepherd Derek McAuley for their valuable comments. Also we thank Steve Skiena for recommending the Earth Mover's Distance algorithm. This work was partially made possible by NSF CAREER EIA-0133589, CCR-0310493, and HECURA CCF-0621463 awards and HP/Intel gifts numbers 87128 and 88415.1.
For more information and software, see
www.fsl.cs.sunysb.edu/project-osprof.html.

References

[1]
M. K. Aguilera, J. C. Mogul, J. L. Wiener, P. Reynolds, and A. Muthitacharoen. Performance debugging for distributed systems of black boxes. In Proc. of the 19th ACM Symposium on Operating Systems Principles, pp. 74-89, Bolton Landing, NY, October 2003.
[2]
J. M. Anderson, L. M. Berc, J. Dean, S. Ghemawat, M. R. Henzinger, S. A. Leung, R. L. Sites, M. T. Vandevoorde, C. A. Waldspurger, and W. E. Weihl. Continuous profiling: Where have all the cycles gone? In Proc. of the 16th Symposium on Operating Systems Principles, pp. 1-14, Saint Malo, France, October 1997
[3]
A. C. Arpaci-Dusseau and R. H. Arpaci-Dusseau. Information and Control in Gray-Box Systems. In Proc. of the 18th ACM Symposium on Operating Systems Principles, pp. 43-56, Banff, Canada, October 2001
[4]
Bell Laboratories. prof, January 1979. Unix Programmer's Manual, Section 1.
[5]
S. Browne, J. Dongarra, N. Garner, K. London, and P. Mucci. A scalable cross-platform infrastructure for application performance tuning using hardware counters. In Proc. of the 2000 ACM/IEEE conference on Supercomputing, pp. 42-54, 2000.
[6]
R. Bryant and J. Hawkes. Lockmeter: Highly-informative instrumentation for spin locks in the Linux kernel. In Proc. of the 4th Annual Linux Showcase and Conf., pp. 271-282, Atlanta, GA, October 2000.
[7]
N. C. Burnett, J. Bent, A. C. Arpaci-Dusseau, and R. H. Arpaci-Dusseau. Exploiting Gray-Box Knowledge of Buffer-Cache Contents. In Proc. of the Annual USENIX Technical Conf., pp. 29-44, Monterey, CA, June 2002.
[8]
B. Cantrill, M. W. Shapiro, and A. H. Leventhal. Dynamic Instrumentation of Production Systems. In Proc. of the Annual USENIX Technical Conf., pp. 15-28, 2004.
[9]
M. Chen, A. Accardi, E. Kiciman, D. Patterson, A. Fox, and E. Brewer. Path-Based Failure and Evolution Management. In 1st USENIX/ACM Symposium on Networked Systems Design and Implementation, pp. 309-322, San Francisco, CA, March 2004.
[10]
W. Cohen. Gaining insight into the Linux kernel with Kprobes. RedHat Magazine, March 2005.
[11]
E. Cota-Robles and J. Held. A Comparison of Windows Driver Model Latency Performance on Windows NT and Windows 98. In Proc. of the Third Symposium on Operating Systems Design and Implementation, pp. 159-172, New Orleans, LA, February 1999.
[12]
P. Druschel and G. Banga. Lazy Receiver Processing (LRP): A Network Subsystem Architecture for Server Systems. In Proc. of the Second Symposium on Operating Systems Design and Implementation, pp. 261-275, Seattle, WA, October 1996.
[13]
D. Ellard and M. Seltzer. New NFS Tracing Tools and Techniques for System Analysis. In Proc. of the Annual USENIX Conf. on Large Installation Systems Administration, San Diego, CA, October 2003.
[14]
Y. Endo, Z. Wang, J. B. Chen, and M. Seltzer. Using Latency to Evaluate Interactive System Performance. In Proc. of the Second Symposium on Operating Systems Design and Implementation, pp. 185-199, Seattle, WA, October 1996.
[15]
S. L. Graham, P. B. Kessler, and M. K. McKusick. Gprof: A call graph execution profiler. In Proc. of the 1982 SIGPLAN symposium on Compiler construction, pp. 120-126, June 1982.
[16]
G. Hunt and D. Brubacher. Detours: Binary Interception of Win32 Functions. In Proc. of the 3rd USENIX Windows NT Symposium, July 1999.
[17]
M. Jones and J. Regehr. The Problems You're Having May not Be the Problems You Think You're Having: Results from a Latency Study of Windows NT. In Proc. of the 1999 Workshop on Hot Topics in Operating Systems (HotOS VII), pp. 96-102, Rio Rico, AZ, March 1999.
[18]
N. Joukov and E. Zadok. Adding Secure Deletion to Your Favorite File System. In Proc. of the third international IEEE Security In Storage Workshop, San Fransisco, CA, December 2005.
[19]
J. Katcher. PostMark: A New Filesystem Benchmark. Tech. Rep. TR3022, Network Appliance, 1997. www.netapp.com/tech_library/3022.html.
[20]
S. Kullback and R. A. Leibler. On information and sufficiency. Annals of Mathematical Statistics, 22(1):79-86, March 1951.
[21]
J. Levon and P. Elie. Oprofile: A system profiler for linux. http://oprofile.sf.net, September 2004.
[22]
R. N. Mantegna and H. E. Stanley. An Introduction to Econophysics: Correlations and Complexity in Finance. Cambridge University Press, 2000.
[23]
M. K. McKusick. Using gprof to tune the 4.2BSD kernel. http://docs.freebsd.org/44doc/papers/kerntune.html, May 1984.
[24]
M. K. McKusick, W. N. Joy, S. J. Leffler, and R. S. Fabry. A fast file system for UNIX. ACM Transactions on Computer Systems, 2(3):181-197, August 1984.
[25]
Microsoft Corporation. File System Filter Manager: Filter Driver Development Guide. www.microsoft.com/whdc/driver/filterdrv/default.mspx, September 2004.
[26]
A. Morton. sleepometer. www.kernel.org/pub/linux/kernel/people/akpm/patches/2.5/2.5.74/2.5.74-mm1/broken-out/sleepometer.patch, July 2003.
[27]
J. Nugent, A. Arpaci-Dusseau, and R. Arpaci-Dusseau. Controlling Your PLACE in the File System with Gray-box Techniques. In Proc. of the Annual USENIX Technical Conf., pp. 311-323, San Antonio, TX, June 2003.
[28]
V. Prabhakaran, A. C. Arpaci-Dusseau, and R. H. Arpaci-Dussea. Analysis and Evolution of Journaling File Systems. In Proc. of the Annual USENIX Technical Conf., Anaheim, CA, May 2005.
[29]
M. Rosenblum and J. K. Ousterhout. The design and implementation of a log-structured file system. In Proc. of 13th ACM Symposium on Operating Systems Principles, pp. 1-15, Asilomar Conf. Center, Pacific Grove, CA, October 1991.
[30]
Y. Ruan and V. Pai. Making the "Box" Transparent: System Call Performance as a First-class Result. In Proc. of the Annual USENIX Technical Conf., pp. 1-14, Boston, MA, June 2004.
[31]
Y. Rubner, C. Tomasi, and L. J. Guibas. A Metric for Distributions with Applications to Image Databases. In Proc. of the Sixth International Conf. on Computer Vision, pp. 59-66, Bombay, India, January 1998.
[32]
J. Seward, N. Nethercote, and J. Fitzhardinge. Valgrind. http://valgrind.kde.org, August 2004.
[33]
Silicon Graphics, Inc. Kernprof (Kernel Profiling). http://oss.sgi.com/projects/kernprof, 2003.
[34]
Sun Microsystems. Analyzing Program Performance With Sun Workshop, February 1999. http://docs.sun.com/db/doc/805-4947.
[35]
M. J. Swain and D. H. Ballard. Color indexing. International Journal of Computer Vision, 7(1):11-32, 1991.
[36]
Sysinternals.com. Filemon. www.sysinternals.com/ntw2k/source/filemon.shtml, 2004.
[37]
E. Zadok and J. Nieh. FiST: A Language for Stackable File Systems. In Proc. of the Annual USENIX Technical Conf., pp. 55-70, San Diego, CA, June 2000.

Footnotes:

1Appears in the Proceedings of the 7th USENIX Symposium on Operating Systems Design and Implementation (OSDI 2006)


File translated from TEX by TTH, version 3.76.
On 8 Sep 2006, 12:12.