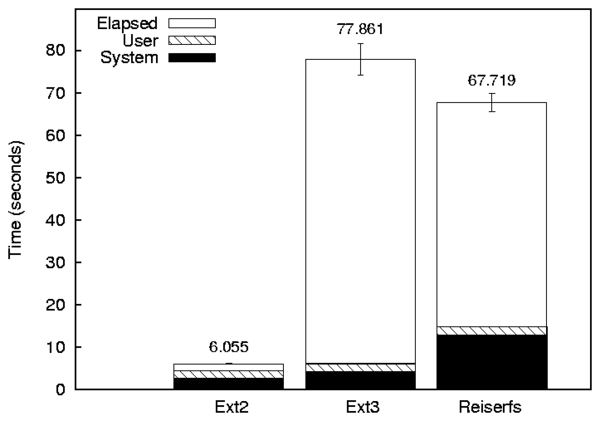
Figure 8.1: A bar graph with three series (Ext2, Ext3, and Reiserfs) and three components (Elapsed, System, and User).
Graphit is a Perl script that generates both line and bar graphs using Gnuplot 3.8j or higher. Graphit automatically processes Getstats output, results files (by executing Getstats), and CSV files. Each input file is treated as a series, and has several components. To properly read this section, you should use the Postscript viewer (or HTML), as info may not correctly display images.
In a bar graph, each series creates a group of bars. In fig:bargraph, the series are Ext2, Ext3, and Reiserfs. Each component becomes a bar in each series. In fig:bargraph, the components are Elapsed, System, and User.
Figure 8.1: A bar graph with three series (Ext2, Ext3, and Reiserfs) and three components (Elapsed, System, and User).
In a line graph, a line is created for the cross product of the series and components. In fig:linegraph, there are two components and series. The components are Elapsed and System, and the series are Ext3 and Reiserfs. Of special note is that this line graph actually has more points than the corresponding bar graph even though it has fewer series and components. This is because each series-component combination in a line graph can have any number of points (in this case six), but a series-component combination only has a single point in a bar graph. Another important distinction between line and bar graphs is that bar graphs use an artificial x-axis, but a line graph uses an x-axis based on an actual quantity (for example, the number of threads).
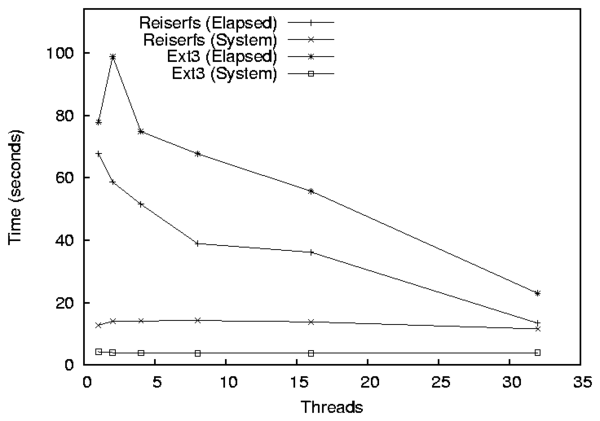
Figure 8.2: A line graph with two components (Elapsed and System) and two series (Ext3 and Reiserfs). Each series-component combination has six points.
Graphit has three required options as follows:
bar|lineAfter the options, Graphit takes an even number of arguments, which are pairs that define the graph's series. The first element of the pair is the series name (e.g., Ext2). The second element is the input that defines the series. The input specification is parser specific.
To create a bar graph using Getstats output the input specification is a file name. The file can either be a the output from a single run of Getstats (the tabular report, without the warnings), or an Auto-pilot results file. If an Auto-pilot results file is specified, then Getstats is executed using the command getstats --set warn=0 file, to create a corresponding tabular report.
When you specify the output of Getstats, Auto-pilot only handles files that contain a single result. To handle files with more than one result, then you must use the syntax file@index, where file is the name of the file and index is the name of the sample within the file. For example in the following file named summary:
samples/ext2:1.res
NAME    COUNT MEAN   MEDIAN LOW    HIGH   MIN    MAX    SDEV%  HW%
Elapsed 10    8.168  8.154  8.131  8.205  8.112  8.271  0.633  0.453
System  10    0.140  0.135  0.119  0.161  0.100  0.190  20.757 14.849
User    10    0.021  0.020  0.011  0.031  0      0.040  65.253 46.680
Wait    10    8.007  7.987  7.967  8.047  7.957  8.131  0.697  0.498
CPU%    10    1.971  1.786  1.669  2.272  1.466  2.690  21.413 15.318

samples/ext2:2.res
NAME    COUNT MEAN   MEDIAN LOW    HIGH   MIN    MAX    SDEV%  HW%    O/H
Elapsed 10    16.155 16.142 16.129 16.182 16.131 16.252 0.229  0.164  97.780
System  10    0.292  0.280  0.238  0.346  0.170  0.430  25.770 18.435 108.571
User    10    0.029  0.030  0.019  0.039  0.010  0.050  47.252 33.803 38.095
Wait    10    15.834 15.846 15.779 15.890 15.709 15.936 0.489  0.350  97.747
CPU%    10    1.987  1.891  1.644  2.330  1.301  2.905  24.142 17.271 0.820
There are two possible index values: samples/ext2:1.res and samples/ext2:2.res. To specify the first set, you would use summary@samples/ext2:1.res. Correspondingly the second set is summary@samples/ext2:2.res.
To create a line graph using Getstats output the input specification is
a set of files using a shell globbing pattern. By default, the files'
common prefix and suffix are removed to determine the x-axis position
for a given file. For example, ext2:1.res and ext2:2.res
have a common prefix of ext2: and a common suffix of .res,
therefore ext2:1.res is located at 1 on the x-axis and
ext2:2.res is located at position 2 on the x-axis.
You must specify the globbing pattern, not the files on the Graphit
command line, so it must be quoted (e.g., graphit [options] Ext2
'ext2:*.res'), so that the shell does not expand the glob.
Sometimes the common prefix is too large. For example,
test:100.res and test:1000.res have a common prefix of
test:100, and a common prefix of .res. In these cases you
must manually specify the prefix and suffix. To pass arguments to a
parser use the --Xparser option. For example, graphit
[options] --Xparser='--prefix=test:' --Xparser='--suffix=.res' Test
'test:*.res'.
If you specify incorrect --Xparser options, the parsers do not
issue warnings or errors, because each parser has access to all parser
options, and the valid options are different for different parsers.
To specify files with multiple results, the syntax is similar to bar graphs, but you can use file globs both for the summary and index. If an index is used, then the index is computed before globbing is applied. Therefore, * matches all files, but no indexes. The pattern *@*, matches all files and all indexes.
A single CSV files can represent multiple series and components. For a
bar graph, the columns are the components, and each row (line) is a
series. The input specification is a single CSV file, but the series
specification is special: it is a regular expression that matches the
x-value in the CSV file. For bar graphs, each x-value becomes a set of
bars.
For example, if you have a CSV file with the x-value column
"Filesystem", you use the regular expression Ext. to graph only
Ext2 and Ext3.
If not all components in the CSV file are being graphed, it is not clear
what the x-value should be (if all of the other components are being
graphed, the only remaining one is used as an x-value). To specify the
column for the x-value, use the --xcol parser argument as
follows graphit [options] --Xparser='--xcol=Column'.
For a line graph, the CSV uses a normal series specification (not a regular expression), and the input specification is a single file. Each column is a component (or used to determine the x-value). If all columns except one are used for the components, then the remaining column is automatically selected for the x-value. The --xcol parser option is used to select the column for the x-value, which must be numeric. Each row represents a single position along the x-axis.