Compiler-Assisted Software Verification Using Plug-Ins
Sean Callanan,
Radu Grosu,
Xiaowan Huang,
Scott A. Smolka, and
Erez Zadok
Stony Brook University
1
Abstract
We present Protagoras, a new plug-in architecture for the GNU
compiler collection that allows one to modify GCC's internal
representation of the program under compilation. We illustrate the
utility of Protagoras by presenting plug-ins for both compile-time and
runtime software verification and monitoring. In the compile-time
case, we have developed plug-ins that interpret the GIMPLE
intermediate representation to verify properties statically. In the
runtime case, we have developed plug-ins for GCC to perform memory
leak detection, array bounds checking, and reference-count access
monitoring.
1 Introduction
In this paper we discuss compiler-assisted instrumentation, a
form of instrumentation in which the compiler is enlisted to insert
patch code. Patch code is inserted at specific locations in an
existing program for diagnostic or repair purposes without altering
its source code. The instrumentation is performed as the compiler
transforms the source code into object code. The compiler is highly
suitable for use in instrumentation for two reasons. First, it is
aware of the source-level structure of the program being instrumented,
and can therefore be both flexible and precise in selecting points at
which patch code should be inserted. Second, it is aware of the
assignment of variables to registers, making it easy for patch code to
extract information about its environment. This makes it possible to
instrument and debug code with full optimization, for instance.
We also present a technique called compiler-assisted
verification, in which compile-time information is used to verify the
correctness of a program while its intermediate representation is
transformed. The compiler is a particularly suitable environment for
verification because the internal structure of the program in the
compiler is in an easy-to-parse format that retains much of the
program's high-level semantics while nevertheless being reducible to
the actual generated code accurately.
Compiler-assisted instrumentation and verification have the following
three advantages:
- Versatility: Access to the full parse tree and control flow
graph of a program allows instrumentation of a wide variety
of code patterns with full type information; furthermore, it allows
verification of any program in any language supported by the compiler.
- Accuracy: Instrumentation can be used in combination with
full compiler optimization, making results as close as possible to
the uninstrumented program. Verification is performed on the same
intermediate representation that is compiled to make the executable.
- Speed: Compiler-assisted instrumentation makes monitoring
functionality part of the program itself.
We believe that the potential exists for many compiler-assisted
instrumentation tools with applications in a wide range of areas. We
have developed a plug-in architecture called Protagoras, which permits
insertion of new code into GCC, the GNU compiler
collection [5]. (Protagoras is named after the first Greek
sophist, who was interested in using criticism and modification to
extract hidden truths from arguments.) GCC is the compiler of choice
for most open-source software, and is also used for many commercial
programs, including the MacOS-X operating system. We are
developing program understanding, verification, and debugging tools
using Protagoras. However, GCC's internals were not designed with
this kind of tool in mind, so the learning curve for writing such a
tool can be quite steep. In this paper, we present relevant
aspects of GCC's internals, as well as several examples of
instrumentation tools we have developed.
The rest of this paper is structured as follows.
In Section 2 we present related techniques and
compare them to compiler-based instrumentation and verification.
In Section 3 we outline the facilities that
GCC provides for analysis of the GIMPLE intermediate representation.
Instrumentation tools use these to construct code, and verification
tools use them to check code.
In Section 4 we describe Protagoras's role in
compilation, and we enumerate several plug-ins we have created using
it.
Finally, in Section 5, we discuss future tools we would
like to implement, as well as extensions to GCC which would further
facilitate compiler-assisted instrumentation and verification.
2 Related Work
Instrumentation is not limited to the compiler. After the binary has
already been generated, tools like the ATOM library are capable of
instrumenting arbitrary binaries [11]. Such tools can be used
with programs whose source is not available. However, to find
locations to instrument, one must know the specifics of how the binary
was generated by the compiler. Additionally, it is difficult (and, in
the case of optimized code, virtually impossible) to extract
higher-level information from assembly code. Instrumentation can also
be performed by modifying a program's source code directly. For
example, Lockmeter wraps the spinlock-access macros in the Linux
kernel with accounting code [2]. The wrappers record how
much time was spent waiting for the lock, how long the lock was held,
and where in the code it was taken. Finally, instrumentation can be
added at runtime, such as with DTrace [3].
However, this requires that instrumentation hooks have been inserted
into the program.
Debuggers are a competing technology for instrumentation. Compilers
already provide debugging information, which contains information
about a program's stack structure and original source code, and can be
used by debuggers to investigate the state of a paused or crashed
program. However, a debugger is an inefficient mechanism for
monitoring and verifying properties at many points in a program.
There are three reasons for this. First, because the debugger and the
program run in separate memory spaces, there are two context switches
at each instrumentation point. Second, the debugger must traverse the
debugging data structures, which are frequently complex. Third, in
some common debugging formats like STABS, debugging information is
spread throughout the binary [10].
Compiler-assisted instrumentation itself is not a new idea: the
gprof utility also uses the compiler to instrument a
program [6]. gprof relies on the GNU C compiler to
add patch code to each location where a function returns to its
caller. This patch code increments a counter corresponding to the
current ácaller, calleeñ pair. These
counters are stored in a file which can then be processed using
gprof to provide a weighted call graph for the program. In a
similar fashion, the gcov tool provides coverage information
for all code lines, as well as information about how often
conditionals were satisfied [4].
A great deal of work has been done on model checking; however, most
model checkers verify properties in programs written in specialized
modeling languages. The SLAM toolkit perform model-checking on
C [1]; however, since it is not integrated into a compiler,
the variant of C that it supports does not track the style of C that is
used in many programs, particularly open-source software.
A model checker that resides in the middle-end of a production compiler
is able to check all programs supported by the compiler, which, in
GCC, means programs in C++, Java, and Fortran, in addition to C.
3 Code Analysis with GCC
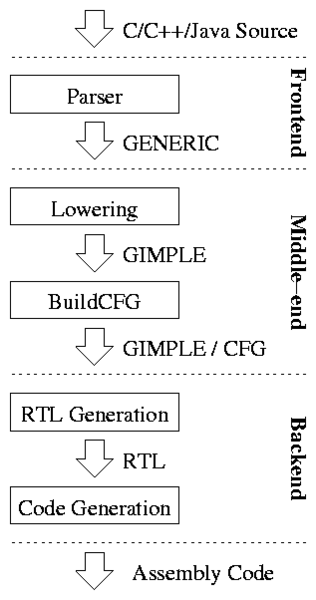
Figure 1 shows the phases of compilation in GCC
version 4. We will briefly describe what is done at each level, and
describe the information that is available to compiler-aided
instrumentation and verification code at that level.
 Figure 1: GCC Architecture
Source code is accepted from the preprocessor, and passed to a
language-specific parser. The parser transforms the code into a
language-dependent tree representation, which is either the GENERIC
intermediate representation or is converted into GENERIC at the end of
parsing [9]. GENERIC is a language of complex
statements, where expressions can be nested several statements deep.
To simplify processing, GENERIC is lowered, or decomposed, into
a three-address code called GIMPLE. GIMPLE is a subset of GENERIC with
temporary variables created to hold intermediate values of
computations. This process is known as gimplification. GCC
then builds a control-flow graph from the GIMPLE code and passes the
resulting structure to the backend for conversion into RTL, an
assembly-like notation which is well-suited for subsequent conversion
to native code. Code can be modified and optimized at each of these
three layers:
- At the GENERIC level, many language-specific structures are
preserved. For example, loops are intact here, whereas they are
reduced to conditionals and goto statements in the
GIMPLE representation. Code that specifically diagnoses
for statements as distinct from while and
if statements, for example, should operate at the GENERIC
level.
- At the GIMPLE/CFG level, complicated structures have been
gimplified, making them easier to parse and modify. This is a good
place for tools that are less concerned with specific code constructs
and are instead concerned with data modifications and control flow.
Additionally, control flow information can be exploited to verify and
instrument temporal patterns.
- At the RTL level, higher-level structural information has been
largely replaced with low-level information. This is a good place
for verification and instrumentation that is specific to the
underlying machine, and needs to know about the instructions that
will be generated.
In our work thus far, we have used the middle-end, and specifically
the GIMPLE/CFG level. This was done for three reasons. First, the
middle-end has access to high-level semantic information such as
symbol names and types, making it easier to find specific locations in
the source code without needing to know details of how they are
transformed into assembly. These details differ between compilers and
even compiler versions. Second, the middle-end is both language and
platform independent, making code written there portable to all
languages and platforms which GCC supports. Third, APIs in the
middle-end, in particular the GIMPLE intermediate representation, are
deliberately preserved between GCC versions. This is because they are
used by GCC's tree optimizations, such as loop unrolling.
 Figure 2: The GIMPLE CFG and tree traversal API
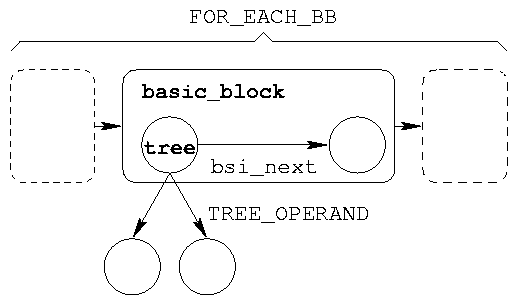
The GIMPLE intermediate representation of a function has the structure
of a control flow graph, as seen in Figure 2. The
basic_block structure contains connections to other basic
blocks, as well as forward and backward pointers representing the
order in which basic blocks appear in the code. These can be
traversed using the FOR_EACH_BB macro. Each basic block
consists of statements, which may be traversed using a statement
iterator. The following example code traverses an entire function:
basic_block bb;
block_stmt_iterator iter;

FOR_EACH_BB(bb) {
  for(iter = bsi_start(bb);
      !bsi_end_p(iter);
      bsi_next(&iter)) {
    tree stmt = bsi_stmt(iter);
  }
}
The tree structure is the central data structure in GIMPLE,
representing a node in the abstract syntax tree. Trees can represent
expressions, types, and declarations, among other syntactic
structures. The full set of tree types is specified in the file
tree.def, which contains lines of the form:
DEFTREECODE(id, name, flags, parameters);
These can be used to handle all possible GIMPLE tree types by defining
DEFTREECODE as a macro as in the following example:
#define DEFTREECODE(i, n, f, p) \
  case i: walk(subtree, n);     \
          break;

void walk_expr(tree curr, int numargs)
{
  in i;
  for(i = 0; i < numargs; i++) {
    tree subtree =
      TREE_OPERAND(curr, i);
    if(subnode)
      switch(TREE_CODE(subtree)) {
        #include <tree.def>
      }
  }
}
This function uses the entries in tree.def as the cases for a
large switch statement which is applied to all subtrees of
the current tree, passing the number of subtrees of the subtree to
itself in a recursive manner.
In the rest of this section, we describe the technical aspects of
creating trees. Although these are presented as ways of creating
GIMPLE trees, the techniques also apply equally to the GENERIC
abstract syntax tree, because GIMPLE is a subset of GENERIC. We first
discuss types, which must be specified for all expressions, in
Section 3.1. We discuss the basic API for
creating an expression node, the buildn macros, in
Section 3.2. Finally, we discuss function calls
in Section 3.3.
Every GIMPLE expression has a type. These types can be specific to a
particular language, but there are also common types. The
TREE_TYPE macro returns the type of an existing expression,
suitable for reuse. Some standard C integer types, like
unsigned_char_type_node, are defined in tree.h.
Pointer types can be derived by applying build_pointer_type
to an existing type. Compound types can be constructed via macros;
for example, the following example code creates a type node for an
array of three characters:
tree array3 =
  build_array_type(
    char_type_node,
    build_index_type(size_int(3))
  );
When calling a function that has not yet been seen (such as when
inserting patch code that will be linked in), one must construct a
function declaration for it. This involves both creating a symbol
name for it and declaring its type. The
build_function_type function takes two parameters: the
return type and the parameter types. In practice, however, the return
type is the only important type: the parameter types can be omitted.
The following code creates a declaration for a function named
__logger, which returns void.
tree logger_name =
  get_identifier("__logger");

tree logger_type =
  build_function_type(
    void_type_node,
    NULL_TREE /* omitted */
  );

tree logger_decl =
  build_decl(
    FUNCTION_DECL,
    logger_name,
    logger_type
  );
3.2 Expressions
Once a type has been derived from an existing expression or created
anew, its corresponding expression can be constructed. The simplest
expression types are constants, for which special helper functions
usually exist. For example, the build_int_cst function
takes a type and an integer value, and returns a tree
corresponding to that integer constant. A string constant is
constructed using the build_string function, but its type
must be set manually using the TREE_TYPE macro as follows:
TREE_TYPE(mystr) = array3;
Another basic expression type is a variable access. In many cases,
variables are reused by extracting them from an existing function.
However, if a new variable is to be constructed, this can be done by
constructing a declaration in a similar way to the way a function is
declared, except that the type should not be a function type and
VAR_DECL should be passed to build_decl instead of
FUNCTION_DECL.
There is a separate tree type for each possible operator. For
example, PLUS_EXPR represents binary addition, and
ADDR_EXPR takes the address of its operand. It is important
to bear in mind that at this point in the compilation process, GCC
cannot infer the type of such an expression, and the type must be
explicitly specified. The buildn family of macros
constructs n-ary tree nodes; for example, the following code creates
a tree that represents the sum of two integers:
tree sum_tree =
  build2(
    PLUS_EXPR,
    integer_type_node,
    addend1,
    addend2
  );
For some purposes, such as when specifying the parameters of a
function, a variable-length list of elements is required. In this
case, a container node is required: specifically, a
TREE_LIST. Lists are created by using the
tree_cons function. We show how to construct a list
in Section 3.3.
3.3 Function Calls
A function call is one of the more complex constructs in GIMPLE. The
function declaration must first be constructed, as seen in
Section 3.1. Next, a function pointer must be
constructed using special type qualifiers as follows:
tree logger_pointer =
 build1(
  ADDR_EXPR,
  build_pointer_type(
   build_type_variant(
    TREE_TYPE(logger_decl),
    TREE_READONLY(logger_decl),
    TREE_THIS_VOLATILE(logger_decl)
   ),
  logger_decl)
 );
The parameters are then composed into a list using the
tree_cons function. This function takes three parameters.
The first is a key called a purpose, which is unused
in function calls. The second parameter is the value of the list
entry. The third parameter is the list to prepend it to (or NULL if a
new list is to be created). Finally, the function call is constructed
using the build_function_call function:
tree arguments =
  tree_cons(NULL, mystr, NULL);

new_call =
  build_function_call(
    logger_pointer,
    arguments
  );
4 Applications
Having discussed the fundamental techniques used to implement
compiler-assisted instrumentation and verification, we now turn to
some applications we have developed using this technique. For these
applications, we have developed a plug-in architecture for GCC called
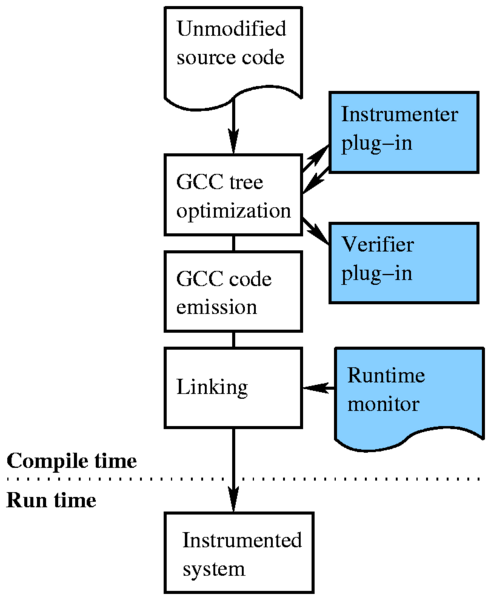
Protagoras. Protagoras is a set of modifications to the compiler,
which allow it to load plug-ins that analyze or modify the GIMPLE
representation of each function after the control-flow graph has been
generated. We also modified the build process of GCC to make the
compiler export symbols to plug-ins. We instrument code by adding
calls to separately compiled patch functions which are linked
in after compilation. The architecture of this system is shown in
Figure 3.
 Figure 3: Our instrumentation system. The components of
Protagoras are highlighted.
This system has two advantages, both directly related to speed of
development. First, the development of plug-ins separately from the
GCC code-base eliminates time-consuming link phases. Second, the use
of separately compiled and linked patch code obviates the need to
construct large amounts of C code in raw GIMPLE, which is a
time-consuming and error-prone process as seen in
Section 3.
We will discuss three applications of compiler-assisted
instrumentation: a malloc() debugger in
Section 4.1, a bounds checker in
Section 4.2, and a reference-count checker for the
Linux kernel in Section 4.3. Additionally, we will
discuss an example of compiler-assisted verification, a model-checking
plug-in that interprets GIMPLE code, in Section 4.4.
4.1 malloc() Debugging
We have implemented a malloc debugger for GCC that locates
all uses of the malloc and free functions in a
program's source code and appends a call to an appropriate logging
function which is defined in a separate static library as shown in
Figure 3. While the program runs, the logging
functions maintain a list of existing allocations; it reports any
invocations of free on unallocated areas, and any
malloced areas that have not been freed by the end of
the program's execution.
The way we perform the instrumentation of a malloc invocation
in GCC is by deconstructing its parent assignment expression. Even if
the result of the malloc is directly passed to a function,
say f, in the C source code, in the GIMPLE representation it
is put into a temporary variable, which in turn is passed to
f. The tree representing the assignment of the
result of malloc to a variable is a MODIFY_EXPR,
with the variable as its first parameter and a CALL_EXPR to
malloc as the second. We construct a call to the logger,
passing the result variable and the parameter of the malloc
call-which specifies the size of the area-as well as the location of
the call in the C source code.
The location of a particular GIMPLE expression in the original C
source code can be extracted using the EXPR_LINENO and
EXPR_FILENAME macros. Additionally, we can check for coding
anomalies like passing a literal to free by checking what
kind of a tree the parameter to free is. We
dispatch compiler warnings using the warning function.
4.2 Bounds Checking
We have also implemented a bounds checker for GCC that identifies all
valid memory areas in the text segment of a binary, all stack areas,
and all heap allocations used by a function; it then inserts patch
code to verify that every memory access of that function lies within
those bounds. These areas are not limited to arrays; we also allow
dereferencing of char pointers that point to portions of a
32-bit int variable, for instance. As in
Section 4.1, this is achieved using logging functions:
one to register an area, one to deregister an area, and one to check
an access for validity, while the program is executed.
In the case of heap areas, accounting is simple, since heap areas are
made valid explicitly through the malloc function and
invalidated using the free function. Text areas are
registered at the start of the first function that uses them; stack
areas are registered at the start of their corresponding functions,
and deregistered when the functions exit. We invoke a compiler pass
to collect all variables referenced in a function as follows:
pass_referenced_vars.execute();

for(i = 0;
    i < VARRAY_ACTIVE_SIZE(
          referenced_vars
        );
    i++) {
  tree variable =
    VARRAY_TREE(referenced_vars, i);
  if(DECL_ARTIFICIAL(variable))
    /* temporary variable */
  else if(TREE_STATIC(variable))
    /* text variable */
  else
    /* stack variable */
}
Now that accounting for stack, heap, and text areas has been inserted,
what remains is to instrument pointer dereferences. This is done by
finding tree entities with type INDIRECT_REF. The
argument of the dereference operator is passed to the validator
function, which reports an access that is not inside a valid area.
4.3 Reference Count Verification
We implemented a tool that locates modifications of reference counters
in the Linux kernel and verifies the correctness of these operations,
as well as checking for leaks, while the system runs. A reference
count leak causes not only resource leakage but also faulty system
operation as synchronization based on reference counts
malfunctions [12]. This tool identifies all locations
where variables of type atomic_t (the type used in the Linux
kernel for reference counters) are modified. Linux includes a set of
functions that modify these variables correctly, but atomic variables
are modified directly without using these functions at several
locations in the kernel code.
The type name for a complex type can be extracted using the
TYPE_NAME macro, but it is represented as an identifier
node. As a result, the IDENTIFIER_POINTER macro must be
applied to the identifier to return a standard C string. Since Linux
kernel atomic types are not standard C types, we must compare this
name with the string atomic_t to locate atomic variables.
Our reference-count monitor computes error rates and disables
instrumentation once a high enough confidence has been achieved that
the error rate is very close to zero. Additionally, we found it
desirable to maintain per-category confidence levels. Different kinds
of objects are handled by different parts of the kernel, and these
parts may be different both in the frequency with which they access
reference counters and in their correctness. To do this, we needed a
way to determine the container object type of a reference count. If
the reference counter is being directly accessed inside a structure,
then we can simply look at its parent structure's type as follows:
tree container_type =
  TREE_TYPE(
    TREE_OPERAND(object, 0)
  );
However, if the address of the reference counter has been placed in a
temporary variable, then we must keep track of the type of the
container of the object whose address is in the temporary. To do
this, we maintained a hash of tree nodes to container types, which is
updated each time the address of an atomic_t is placed into
another variable.
4.4 Model Checking
The GCC middle-end is useful for more than just instrumentation tools
and optimizers that change the runtime characteristics of an
application. We have also developed a Protagoras plug-in application
that performs compiler-assisted verification: a model checker named
GMC2. It operates on the gimplified source code of a
concurrent program and performs multiple randomized executions on a
simulated machine supporting channel-based IPC [7].
The GMC2 model checker begins interpreting the GIMPLE
source code of a program at a fixed initial state. Whenever the
active thread in the interpreted code invokes a concurrency primitive,
such as thread creation or inter-process communication, a context
switch occurs, allowing a different, randomly-selected thread to run.
The state of the system at this point is stored. If a user-specified
property is violated while the program is being interpreted,
GMC2 records a failure and resets the program's state. It
records a success when a previously observed state is seen
again-that is, a lasso occurs-with no failure having been
observed in the previous execution. Confidence in the overall success
rate increases as the number of recorded lassos increases. In
contrast to other model checkers, GMC2 need only remember
those states observed in the current lasso, taking advantage of
the fact that the randomized executions are independent of each other
and error rates are therefore meaningful.
GMC2 executes GIMPLE source code, so additional
intermediate data is required besides the compile-time information
provided by the GIMPLE API. We have added a hash table which assigns
values to all variables currently in scope. This hash table is used
to interpret all GIMPLE statements. Using the GIMPLE API instead of
the GENERIC API sharply reduces the number of different expression
types we must handle, and also allows us to interpret any language
that GCC supports without adding language-specific interpretation
code.
Another challenge we faced while developing this system was that GCC
transforms code one function at a time. Normally, the resources used
to hold the GIMPLE representation of one function are reused when the
next function is parsed. This is a problem for interpreters, which
require the entire program to be available. For this reason, we
interrupt execution at two points: when each function has been
gimplified and is about to be optimized, and when all functions have
been processed. At the first point, a function's GIMPLE
representation is stored in a separate data structure which is
preserved throughout the compilation. At the second, the code in the
resulting data structure is interpreted.
5 Future Work
Section 4 merely documents a preliminary
exploration of the full space of potential applications for
compiler-assisted instrumentation. However, it is sufficient to
demonstrate the viability of compiler-assisted instrumentation in
general, and the use of our plug-in architecture, Protagoras, to
insert code into the GCC middle-end in particular. It also
identified several areas in which the existing infrastructure is
lacking and could be extended, to exploit the strengths of
compiler-assisted instrumentation while mitigating its weaknesses.
In Section 5.1 we describe two proposed applications of
this technique, including selected choices and challenges presented by
their implementation. In Section 5.2 we describe
two techniques we plan to investigate for improving GCC's support for
compiler-assisted instrumentation and verification tools.
5.1 New Applications
Data structure access logger We will modify every
variable modification, and, as the instrumented program runs, it will
generate a log file which provides a detailed record of when each
variable was modified, where in the code it was modified, and what it
was set to.
We will design a tool to parse these files. It will have the
interface of a standard debugger, with two major differences. First,
as the run of the application will have been logged, it will be
completely reproducible. This will make it feasible, for instance, to
transmit a detailed log of an application's entire run from a test
engineer to a developer, simplifying the task of finding a bug.
Second, the run will be traversable both forward and backward in time,
allowing, for instance, reverse watchpoints, allowing a
programmer to trace the provenance of an anomalous value of a
variable.
The implementation of this tool could be completely at the GIMPLE
level; however, the tool would need to handle library functions like
memcpy separately. Additionally, because the amount of data
generated by this tool could potentially be quite large, this tool
will use bandwidth-reduction techniques like compression,
snapshotting, and pattern-based encoding (such as recording the first
and last values of a loop counter instead of each value). Finally, if
only specific variables or variables of a particular type are of
interest, the tool could be instructed to filter on that basis.
Thread hang detector We will instrument every loop, and
determine the conditions for leaving each loop. Additionally, the
instrumentation tool will enumerate the variables that would be
modified if the loop were left. Based on that information, a
multi-threaded application will be executed in parallel with a
monitor, which will gather information about which threads were
looping, and which loops the threads were in.
The monitor will provide dynamically updated information to the user
about which threads were looping, and will furthermore flag two
threads as potentially being deadlocked if each were waiting in a
condition that involved a variable that the other will touch if it
left its loop. The tool will also generate a general warning if a
thread continues looping for a sufficiently long time.
Loops could be detected in one of two ways. First, a loop could be
detected by inspecting a function's GENERIC tree, which will
potentially make the tool language-specific. This will have the
advantage of making while conditions obvious. The
alternative is to inspect the function's GIMPLE control flow
graph for cycles. Although this would be more computationally
intensive, it would also be more general because, for instance, the
following construct would be handled:
while(1)
  if(x == 0)
    goto out;
out:
Another challenge would be to obtain accurate information about which
variables are still in use after execution leaves a loop. Although it
would be possible to enumerate all such variables in the same
function, we would need to perform rudimentary inter-procedural
analysis to find those of its callees.
5.2 Compiler Extensions
Saved GIMPLE trees The solution of using an external
library to save programmers from writing GIMPLE code (see
Section 4) is unsatisfactory because this
introduces a compulsory function call at each point where patch code
runs. Instead, we propose an API that allows saving a single tree or
a list of trees to a file, and loading them for integration into
another program. With this system, one could write the patch code in
advance and save it to a file, loading it from the file and binding
its variables and types at all locations where the code should run.
Instrumentation specification language In the long term,
we strongly believe that the complexity of compilers and the
difficulty of programming inside a compiler has been a major factor
holding back the development of compiler-assisted instrumentation and
verification tools. Consequently, if such applications were made
easier to develop, many more instrumentation tools would be created.
We share much of this philosophy with the AspectJ
toolkit [8]. We intend to implement an
AspectJ-like system for GCC, obviating the need to use the GIMPLE API
completely.
However, the AspectJ API does not exhaust the possibilities presented
by the GIMPLE API. The GIMPLE API allows the instrumentation writer
to specify not only additions but also transformations of the source
code; for example, GIMPLE can be used to specify loop-unrolling
optimizations. Because a system that allows easy implementation of
instrumentation plug-ins would also be useful for development of
optimizations-just as the reverse is true for the GIMPLE API-we
will attempt to make an interface that is both easy-to-use and
general.
6 Acknowledgments
Abhishek Rai developed an earlier prototype of the container type
detection mechanism and instrumentation for reference-count objects,
described in Section 4.3. Yanhong A. Liu and Scott
D. Stoller provided valuable feedback to the architectural model, as
described in Section 4 and the compiler
extensions proposed in Section 5.2.
This work was partially made possible thanks to a Computer Systems
Research NSF award (CNS-0509230) and an NSF CAREER award in the
Next Generation Software program (EIA-0133589).
References
- [1]
-
T. Ball and S. K. Rajamani.
The SLAM toolkit.
In CAV '01: Proceedings of the 13th International Conference on
Computer Aided Verification, pages 260-264. Springer-Verlag, 2001.
- [2]
-
R. Bryant and J. Hawkes.
Lockmeter: Highly-informative instrumentation for spin locks in the
Linux kernel.
In Proceedings of the 4th Annual Linux Showcase and Conference,
pages 271-282, Atlanta, GA, October 2000. USENIX Association.
- [3]
-
B. Cantrill, M. W. Shapiro, and A. H. Leventhal.
Dynamic Instrumentation of Production Systems.
In Proceedings of the Annual USENIX Technical Conference, pages
15-28, 2004.
- [4]
-
Free Software Foundation.
gcov - a Test Coverage Program.
http://gcc.gnu.org/onlinedocs/gcc/Gcov.html, December 2005.
- [5]
-
The GCC team.
GCC online documentation, December 2005.
http://gcc.gnu.org/onlinedocs/.
- [6]
-
S. L. Graham, P. B. Kessler, and M. K. McKusick.
Gprof: A call graph execution profiler.
In Proceedings of the 1982 SIGPLAN symposium on Compiler
construction, pages 120-126, June 1982.
- [7]
-
R. Grosu, X. Huang, S. Jain, and S. A. Smolka.
Open source model checking.
In Proceedings of the Workshop on Software Model Checking,
Edinborough, Scotland, July 2005. Elsevier.
- [8]
-
G. Kiczales, E. Hilsdale, J. Hugunin, M. Kersten, J. Palm, and W. G. Griswold.
An Overview of AspectJ.
Lecture Notes in Computer Science, 2072:327-355, 2001.
- [9]
-
D. Novillo.
TreeSSA: A New Optimization Infrastructure for GCC.
In Proceedings of the 1st GCC Developers' Summit, Ottawa,
Canada, May 2003.
- [10]
-
The GDB Project.
STABS.
http://sources.redhat.com/gdb/onlinedocs/stabs.html, 2004.
- [11]
-
A. Srivastava and A. Eustace.
ATOM: A system for building customized program analysis tools.
SIGPLAN Not., 39(4):528-539, 2004.
- [12]
-
E. Zadok, S. Callanan, A. Rai, G. Sivathanu, and A. Traeger.
Efficient and safe execution of user-level code in the kernel.
In Proceedings of the 2005 NSF Next Generation Software
Workshop, in conjunction with the 2005 International Parallel and Distributed
Processing Symposium (IPDPS 2005), Denver, CO, April 2005.
Footnotes:
1Appears in the proceedings of the 2006 NSF Next Generation Software Workshop, in conjunction with the 2006 International Parallel and Distributed Processing Symposium (IPDPS 2006)
File translated from
TEX
by
TTH,
version 3.70.
On 22 Jan 2006, 18:53.
