Accurate and Efficient Replaying of File System Traces
Nikolai Joukov, Timothy Wong, and Erez Zadok
Stony Brook University
1
Abstract
Replaying traces is a time-honored method for benchmarking,
stress-testing, and debugging systems-and more recently-forensic
analysis. One benefit to replaying traces is the reproducibility of
the exact set of operations that were captured during a specific
workload.
Existing trace capture and replay systems operate at different levels:
network packets, disk device drivers, network file systems, or system
calls.
System call replayers miss memory-mapped operations
and cannot replay I/O-intensive workloads at original speeds.
Traces captured at other levels miss vital information that
is available only at the file system level.
We designed and implemented Replayfs, the first system for
replaying file system traces at the VFS level.
The VFS is the most appropriate level for replaying file system
traces because all operations are reproduced in a manner that is most
relevant to file-system developers.
Thanks to the uniform VFS API, traces can be replayed
transparently onto any existing file system, even a different one than
the one originally traced, without modifying existing file systems.
Replayfs's
user-level compiler prepares a trace to be replayed efficiently in the
kernel where multiple kernel threads prefetch and schedule the
replay of file system operations precisely and efficiently.
These techniques allow us to replay I/O-intensive traces at different
speeds, and even accelerate them on the same hardware that the
trace was captured on originally.
1 Introduction
Trace replaying is useful for file system benchmarking,
stress-testing, debugging, and forensics. It is also a reproducible
way to apply real-life workloads to file systems. Another advantage
of traces is their ease of distribution.
For benchmarking, synthetically generated workloads rarely
represent real workloads [42].
Compile benchmarks [14]
put little load on the file system and are not
scalable [6].
Real workloads are more complicated than artificially created ones,
so traces of real file system activity make for better test workloads.
They represent the actual file system workloads and can be scaled as needed.
In addition to scaling, captured traces can be modified
in many ways before being replayed.
For example, modification of the disk block locations
can help to evaluate new disk layout
policies [27].
Sometimes trace replaying is used to test a target file system with
a synthetic workload for which
application reproducibility is difficult.
One of the most common examples is the replaying of TPC [35]
traces on file systems, because running the actual benchmark is
complicated and requires a database system. Also, replaying traces that
were captured by others allows a fair comparison of file systems.
Finally, trace replaying is an accurate method to prepare a file system
for benchmarking by aging it [31].
Synthetic benchmarks may be more predictable than real-life workloads,
but they do not exercise many possible file system operation sequences.
Replaying can be used to stress test
a file system under practical conditions.
Trace replaying allows for selectively replaying portions of a trace.
This is useful to narrow down the search for problems
during debugging.
Precise timing and minimal influence on the system being tested are
key requirements to reproduce the exact timing conditions.
Replaying file system traces can be considered a form of fine-grained
versioning. Existing versioning file
systems [32,20] cannot reproduce the timing
and in-memory conditions related to file system modifications.
This makes trace replaying a better choice for forensic
purposes. Replaying traces back and forth in time can be useful for
post-mortem analysis of an attack.
File system traces can be captured and replayed at different logical levels:
system calls, the Virtual File System (VFS),
the network level for network file systems, and the driver level.
The easiest way to collect and replay file system traces is by
recording and reissuing system calls entirely from user mode.
Unfortunately, this method does not capture memory-mapped file
system operations.
This was not a significant problem decades ago but nowadays applications
perform a large portion of their file system interactions via
memory-mapped
operations rather than normal reads and writes [29].
System call replayers have non-zero overheads that
do not allow them to replay high I/O rates of high-performance
applications, or spikes of activity for
applications that may issue most of their I/O requests at low rates.
Several researchers captured file system activity at the VFS level
for Linux [2]
and Windows NT [37,29].
However, no one has replayed traces at the VFS level before.
Network tracers cannot capture the requests satisfied from the client
side or file system caches. Device driver tracers capture raw disk
requests and therefore cannot distinguish between file system
meta-data events (e.g., pathname related calls) and data-related
events. Therefore, network level and driver level replaying are not
comprehensive enough for the evaluation of an entire file system, and
they are primarily suitable for replaying at the same level where they
captured the trace. Nevertheless, both have their uses. For example,
network trace replaying is suitable for the evaluation of NFS servers;
and driver-level replayers are useful to evaluate physical disk
layouts. Also, both techniques have lower overheads because they can
use the CPU time that is normally spent by client-side applications to
prepare events for replaying; this makes network and device-driver
replayers efficient and able to replay high rates of I/O accurately.
We have designed the first VFS-level
replayer which we call Replayfs.
It replays traces captured using the Tracefs stackable
file system [2].
The traces are preprocessed and optimized by our user-level
trace compiler.
Replayfs runs in the kernel, directly above any
directory, file system, or several mounted file systems.
It replays requests in the form of VFS API calls
using multiple kernel threads.
Replayfs's location in the kernel hierarchy
allows it to combine the performance benefits of existing
network and driver-level replayers with the ability to
replay memory-mapped operations and evaluate entire file systems.
Memory-mapped operations can be easily captured and replayed at the
VFS level because they are part of the VFS API, but they are
not a part of the system-call API.
Replayfs uses the time normally spent on context switching,
and on verifying user parameters and copying them,
to prefetch and schedule future events.
In addition, Replayfs saves time between requests
by eliminating data copying between the
kernel and user buffers.
User-mode tools cannot replay the highest possible I/O rates and
spikes of such activity because due to their overheads. This is
ironic because that is exactly the activity that is crucial to replay
accurately. Replayfs can replay high I/O rate traces and spikes of
activity even faster than the original programs that generated them,
on exactly the same hardware. For example, Replayfs can replay read
operations 2.5 times faster than is possible to generate them from the
user level. This allows Replayfs to replay the workload accurately
with the original event rates.
The rest of this paper is organized as follows.
Section 2 describes our capturing and replaying design.
Section 3 describes our implementation.
We evaluate our system in Section 4.
We describe related work in Section 5.
We conclude in Section 6 and discuss future work.
2 Design
The main goal of Replayfs is to reproduce the original file
system workload as accurately as possible. Memory-mapped operations can
be most efficiently captured only in the kernel-they are part of the
VFS API but not the system-call API. Therefore, it is logical for
Replayfs to replay traces at the same level where the traces were captured.
As shown in Figure 1,
Tracefs [2] is a stackable file
system [40]. Tracefs passes through all the
Virtual File System (VFS) requests down to the lower file
system (or a tree of several mounted file systems).
Before invoking the lower operations and after
returning from them, Tracefs logs the input and output values and the
timing information associated with the requests. Replayfs is
logically located at the same level as Tracefs-right above the lower
file system
as shown in Figure 2.
However, Replayfs is not a stackable file system;
it is not a file system either.
It reproduces the behavior of the VFS during the trace capture time
and appears like a VFS for the lower file system.
Replayfs operates similarly to the part of the VFS
which directly interacts with lower file systems.
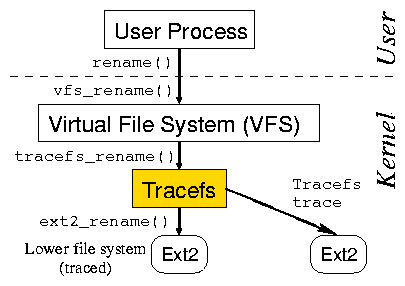 Figure 1: Tracefs is a stackable file system located above
the lower file system and below the VFS.
Figure 1: Tracefs is a stackable file system located above
the lower file system and below the VFS.
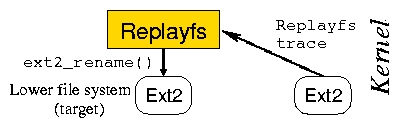 Figure 2: Replayfs is located directly above the lower file system.
It is not a stackable file system.
It is seen like the VFS for the lower file system.
File system related requests interact with each other and with the OS
in intricate ways: concurrent threads use locks to synchronize access,
they compete for shared resources such as disks, the OS may purge
caches due to file system activity, etc. Therefore, to reproduce the
original workload correctly it is necessary to reproduce the original
timing of the requests and their side effects accurately. This is
simple if the file system event rates are low. However, at high I/O
rates, replayers' overheads make it more difficult to replay traces
accurately. Specifically, every request-issuing process consists of
three intervals: user mode activity (tuser), system time activity
of the VFS (tVFS), and the lower file system event servicing time
(tfs). Let us call treplayer the time necessary for a
replayer to prepare for calling a replayed event. Clearly, if the
treplayer > tuser then
the timing and I/O rate could not be reproduced correctly if
events are issued too close to each other
as illustrated in Figure 3.
This could happen, for example, if the trace is generated
by a high performance application or there is a spike of I/O activity.
Unfortunately, such situations are frequent and they
are exacerbated because typical replayers have non-negligible overheads.
Existing system-call replayers have overheads ranging from
10% [1] to 100% [7] and higher.
Replayers' overheads come from the need to prefetch the data,
manage threads, and invoke requests.
Therefore, it is not surprising that no existing
user-mode replayer can replay at the maximum possible application I/O
rates and reproduce the peaks of I/O activity-the modes of file system
activity that are most important for benchmarking and debugging.
Figure 2: Replayfs is located directly above the lower file system.
It is not a stackable file system.
It is seen like the VFS for the lower file system.
File system related requests interact with each other and with the OS
in intricate ways: concurrent threads use locks to synchronize access,
they compete for shared resources such as disks, the OS may purge
caches due to file system activity, etc. Therefore, to reproduce the
original workload correctly it is necessary to reproduce the original
timing of the requests and their side effects accurately. This is
simple if the file system event rates are low. However, at high I/O
rates, replayers' overheads make it more difficult to replay traces
accurately. Specifically, every request-issuing process consists of
three intervals: user mode activity (tuser), system time activity
of the VFS (tVFS), and the lower file system event servicing time
(tfs). Let us call treplayer the time necessary for a
replayer to prepare for calling a replayed event. Clearly, if the
treplayer > tuser then
the timing and I/O rate could not be reproduced correctly if
events are issued too close to each other
as illustrated in Figure 3.
This could happen, for example, if the trace is generated
by a high performance application or there is a spike of I/O activity.
Unfortunately, such situations are frequent and they
are exacerbated because typical replayers have non-negligible overheads.
Existing system-call replayers have overheads ranging from
10% [1] to 100% [7] and higher.
Replayers' overheads come from the need to prefetch the data,
manage threads, and invoke requests.
Therefore, it is not surprising that no existing
user-mode replayer can replay at the maximum possible application I/O
rates and reproduce the peaks of I/O activity-the modes of file system
activity that are most important for benchmarking and debugging.
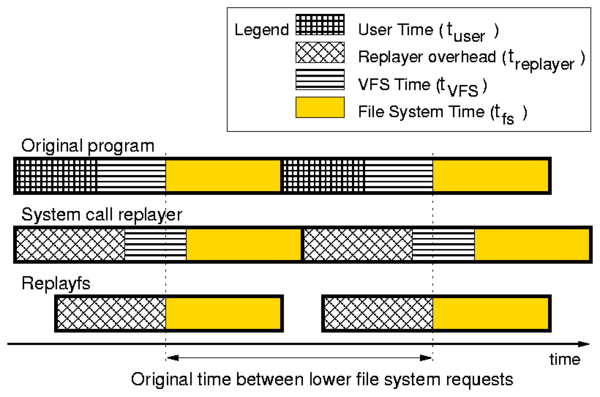 Figure 3: Two consecutive file system events triggered by an
original program, a system calls replayer, and
Replayfs. In this example, Replayfs and the user-mode
replayer have the same per-event overheads.
Nevertheless, the lower file system receives events
at the same time as they were captured if replayed
by Replayfs because treplayer < tuser +tVFS, whereas the system-call replayer is unable to
generate events on time because treplayer > tuser.
Increasing the CPU or I/O speeds solves the problem for
network-file-system trace replayers because the replayer and the
tested file system run on different hardware.
However, non-network file system trace replayers run on the same hardware.
Thus, hardware changes will affect the behavior of the lower file system
together with the replayer:
an increase in the CPU speed can decrease both the
Replayfs overheads as well as the tVFS+tfs component.
This may result in different file system request
interaction, thus changing file system behavior.
Replayfs replays traces directly over the lower file system.
Thus its per-operation overhead has to be smaller than
tVFS+tuser, not smaller than just tuser as illustrated by
the bottom timeline of Figure 3. Therefore, if
the replaying overheads of Replayfs are the same as the overheads of
some user-mode replayer, then Replayfs can replay at higher I/O rates than a
user-mode replayer.
Running in the kernel gives Replayfs several additional advantages
described in this section, resulting in lower overheads. This allows
Replayfs to replay high I/O-rate traces more accurately than any
system-call replayer.
Figure 3: Two consecutive file system events triggered by an
original program, a system calls replayer, and
Replayfs. In this example, Replayfs and the user-mode
replayer have the same per-event overheads.
Nevertheless, the lower file system receives events
at the same time as they were captured if replayed
by Replayfs because treplayer < tuser +tVFS, whereas the system-call replayer is unable to
generate events on time because treplayer > tuser.
Increasing the CPU or I/O speeds solves the problem for
network-file-system trace replayers because the replayer and the
tested file system run on different hardware.
However, non-network file system trace replayers run on the same hardware.
Thus, hardware changes will affect the behavior of the lower file system
together with the replayer:
an increase in the CPU speed can decrease both the
Replayfs overheads as well as the tVFS+tfs component.
This may result in different file system request
interaction, thus changing file system behavior.
Replayfs replays traces directly over the lower file system.
Thus its per-operation overhead has to be smaller than
tVFS+tuser, not smaller than just tuser as illustrated by
the bottom timeline of Figure 3. Therefore, if
the replaying overheads of Replayfs are the same as the overheads of
some user-mode replayer, then Replayfs can replay at higher I/O rates than a
user-mode replayer.
Running in the kernel gives Replayfs several additional advantages
described in this section, resulting in lower overheads. This allows
Replayfs to replay high I/O-rate traces more accurately than any
system-call replayer.
2.1 Replayfs Trace
There is a natural disparity between raw traces and replayable traces.
A trace captured by a tracer is often portable, descriptive, and
verbose-to offer as much information as possible for analysis. A replayable
trace, however, needs to be specific to the system it is replayed on,
and must be as terse as possible so as to minimize replaying overheads.
Therefore, it is natural to preprocess raw traces before replaying
them, as shown in Figure 4. Preprocessing traces allows
us to perform many tasks at the user level instead of adding complexity
to the in-kernel components.
We call the user mode program for conversion and optimization of the
Tracefs raw traces a trace compiler; we call the resulting
trace a Replayfs trace. The trace compiler uses the existing
Tracefs trace-parsing library. However, new trace parsers can be
added to preprocess traces that were captured using different tools,
at different levels, or on different OSs.
The trace compiler splits the raw Tracefs trace into three components,
to optimize the run-time Replayfs operation. Each component has a
different typical access pattern, size, and purpose.
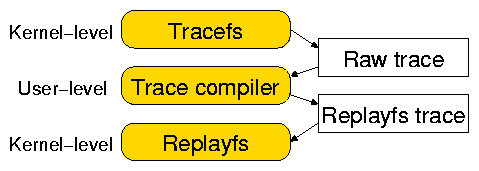 Figure 4: Captured raw traces are compiled into the Replayfs traces before replaying.
The first Replayfs trace component is called commands.
It is a sequence of VFS operations with their associated
timestamp, process ID, parameters, expected return value, and a return object
pointer.
At runtime, the commands are sequentially scanned and replayed one at a time.
Therefore, the sequence of commands can be sequentially prefetched on
demand at runtime.
After the execution of every command, the actual return value is compared
with the return value captured in the original trace.
Replaying is terminated if the expected and actual return values do not match.
The second component is called the Resource Allocation Table (RAT).
Because Tracefs and Replayfs operate on VFS objects whose
locations in memory are not known in advance, and these objects are
shared between the commands, we added a level of
indirection to refer to the commands' parameters and return
values.
Commands contain offsets into the RAT for associated VFS objects
and memory buffers.
Thus, Replayfs populates RAT entries at run-time whereas the trace
compiler creates commands referencing the RAT entries at trace
compile time.
Tracefs captures memory addresses of VFS objects related to the
captured operations.
All VFS objects that had the same memory address during the trace
capture share the same RAT entry.
The RAT is accessed randomly for reading and writing using offsets in the
program elements and therefore the RAT is kept in memory during
the entire replaying process.
We store integer parameters together with the command stream.
This allows us to decrease the size of the RAT and avoid unnecessary
pointer dereferencing.
Another purpose of the RAT is reference counting.
In particular, the reference count of a regular VFS object may be
different from the Replayfs reference count for the same object.
For example, this happens if the object was already in use and had
non-zero reference count at the time a replaying process was
started. We use reference counts to release VFS objects
properly upon the completion of replaying.
The third Replayfs trace component is the memory buffers
necessary to replay the trace.
They include file names and buffers to be written at some point in
time.
These buffers are usually accessed sequentially but some of them may
be accessed several times during the replaying process.
This is usually the largest component of the Replayfs trace.
For replaying, memory buffers are accessed for reading
only because the information read from the disk is discarded.
We outline properties of Replayfs trace components
in Table 1.
Figure 4: Captured raw traces are compiled into the Replayfs traces before replaying.
The first Replayfs trace component is called commands.
It is a sequence of VFS operations with their associated
timestamp, process ID, parameters, expected return value, and a return object
pointer.
At runtime, the commands are sequentially scanned and replayed one at a time.
Therefore, the sequence of commands can be sequentially prefetched on
demand at runtime.
After the execution of every command, the actual return value is compared
with the return value captured in the original trace.
Replaying is terminated if the expected and actual return values do not match.
The second component is called the Resource Allocation Table (RAT).
Because Tracefs and Replayfs operate on VFS objects whose
locations in memory are not known in advance, and these objects are
shared between the commands, we added a level of
indirection to refer to the commands' parameters and return
values.
Commands contain offsets into the RAT for associated VFS objects
and memory buffers.
Thus, Replayfs populates RAT entries at run-time whereas the trace
compiler creates commands referencing the RAT entries at trace
compile time.
Tracefs captures memory addresses of VFS objects related to the
captured operations.
All VFS objects that had the same memory address during the trace
capture share the same RAT entry.
The RAT is accessed randomly for reading and writing using offsets in the
program elements and therefore the RAT is kept in memory during
the entire replaying process.
We store integer parameters together with the command stream.
This allows us to decrease the size of the RAT and avoid unnecessary
pointer dereferencing.
Another purpose of the RAT is reference counting.
In particular, the reference count of a regular VFS object may be
different from the Replayfs reference count for the same object.
For example, this happens if the object was already in use and had
non-zero reference count at the time a replaying process was
started. We use reference counts to release VFS objects
properly upon the completion of replaying.
The third Replayfs trace component is the memory buffers
necessary to replay the trace.
They include file names and buffers to be written at some point in
time.
These buffers are usually accessed sequentially but some of them may
be accessed several times during the replaying process.
This is usually the largest component of the Replayfs trace.
For replaying, memory buffers are accessed for reading
only because the information read from the disk is discarded.
We outline properties of Replayfs trace components
in Table 1.
| Component | Access | In Memory | Read/Write |
| Commands | Sequent. | On demand | Read only |
| RAT | Random | Always | Read+Write |
| Buffers | Random | On demand | Read only |
Table 1: Replayfs trace components' properties.
Figure 5 shows an example Replayfs trace fragment.
In this example, the dentry (Linux VFS directory entry object)
RAT entry is referenced as the output object of
the LOOKUP operation and as the input parameter of the
CREATE operation.
The "foo.bar" file name is such an example buffer.
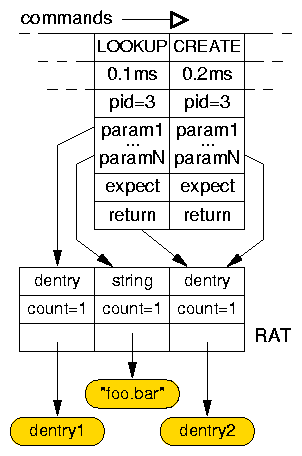 Figure 5: Example Replayfs trace.
Commands reference the Resource Allocation Table (RAT) by the index values.
The RAT points directly to the shared objects in memory.
During the Replayfs trace generation, the trace compiler performs several
optimizations.
We keep the RAT in memory during the entire replaying process.
Therefore, the trace compiler reuses RAT entries whenever
possible. For example, the trace compiler reuses a memory buffer
entry that is not used after some point in time and stores a file
pointer entry that is required only after that point. To minimize the
amount of prefetching of memory buffers, the trace compiler scans
and compares them. Because all the memory buffers are
read-only, all except one of the buffers with exactly the same
contents may be removed from the trace.
Figure 5: Example Replayfs trace.
Commands reference the Resource Allocation Table (RAT) by the index values.
The RAT points directly to the shared objects in memory.
During the Replayfs trace generation, the trace compiler performs several
optimizations.
We keep the RAT in memory during the entire replaying process.
Therefore, the trace compiler reuses RAT entries whenever
possible. For example, the trace compiler reuses a memory buffer
entry that is not used after some point in time and stores a file
pointer entry that is required only after that point. To minimize the
amount of prefetching of memory buffers, the trace compiler scans
and compares them. Because all the memory buffers are
read-only, all except one of the buffers with exactly the same
contents may be removed from the trace.
2.2 Data Prefetching
The commands and buffers components of the Replayfs trace are loaded
into memory on demand. Because future data read patterns are
known, we can apply one of several standard prefetching
algorithms. We have chosen the fixed horizon
algorithm [23] because it works best when the Replayfs
trace is fetched from a dedicated disk. Therefore, we can optimize
the prefetching for low CPU usage. It was theoretically shown that
the fixed horizon and similar algorithms are almost optimal if the
prefetching process is not I/O-bound [5]. We
assume that a dedicated disk is always used for prefetching the
Replayfs trace and therefore the prefetching process is not I/O bound.
The commands and buffers Replayfs trace components can be located
on separate disks to further decrease the I/O contention.
The RAT component is always present in memory and does not interfere
with the prefetching of the other two components.
An additional advantage of the fixed horizon algorithm is small memory
consumption. Note that the information about buffers that require
prefetching is extracted from the future commands. Therefore, we
prefetch the commands stream earlier than it is necessary, to keep up
with the replaying of these commands.
2.3 Threads and Their Scheduling
Replayfs issues requests to the lower file system on behalf of
different threads, if different threads generated these requests
in the original trace.
This is necessary to accurately reproduce and properly exercise the lower file
system in case of resource contention (e.g., disk head repositioning, locks,
semaphores, etc.) and to replay the timing properly if lower operations block.
However, because using an excessive number of threads may hurt
performance [21], Replayfs reuses threads if possible.
In particular, the trace compiler optimizes the commands stream:
file system traces do not contain information about
thread creation and termination times.
Similar to the RAT entries reuse, the trace compiler reuses processes.
Thus, if some program spawns a thread and after its termination it spawns
another one, Replayfs will automatically use one thread to replay
operations invoked by both of them.
To minimize the scheduling-related overheads, Replayfs does not
create a master thread to manage threads.
For example, there is only one thread running if the traced data was
generated by a single process.
It is important to note that the scheduling overheads during replaying
are approximately the same as during the trace capture time.
This is one of the conditions that is necessary to replay traces efficiently
on the same hardware as was used during the trace capture.
Standard event timers have a precision of about 1ms.
To increase the event replaying precision, a pre-spin technique is
commonly used [9,1]:
event timers are set to about 1ms before the actual event time.
The awoken thread then spins in a loop, constantly checking the
current time until the desired event time is reached.
A natural way to lower the CPU load is to use the pre-spinning time
for some other productive activity.
We call this technique a productive pre-spin.
Replayfs uses it to move another thread into the run-queue if
there is enough time before the actual event time and the next
operation has to be replayed by a different thread. The next
thread is not woken up immediately; it is just put on the run-queue.
This way CPU cycles are more effectively spent on moving the process
into a run-queue instead of spinning.
2.4 Zero Copying of Data
One of the main advantages of kernel replayers over user mode
replayers is the ability to avoid copying of unnecessary data
across the kernel-user boundary.
Thus, data from pages just read does not need to be copied
to a separate user mode buffer.
The data read during the trace replaying is of no interest
to the replaying tools.
If desired, checksums are sufficient for data verification purposes.
Instead of copying we read one byte of data from a data page to
set the page's accessed bit.
However, there is no easy way a user-mode program can read data but avoid
copying it to user space. Direct I/O allows programs to avoid extra
data copying but is usually processed differently at the file system
level and therefore the replaying would be inaccurate if normal read
or write requests are
replayed as direct I/O requests.
Avoiding the data copying is more difficult for write operations.
However, kernel-mode replayers have access to low-level file system
primitives.
For example, a data page that belongs to the trace file
can be simply moved to the target file by just changing several pointers.
Therefore, even for writing, most data copying can be eliminated.
Elimination of unnecessary data copying reduces the CPU and
memory usage in Replayfs.
Note that user-mode replayers that do not use direct I/O for fetching
the data from the disk, have to copy the data twice:
first, they copy it from the kernel to the user space buffers when they
load the trace data;
then they copy the data to the kernel when they issue a write request.
2.5 File System Caches
File system page caches may be in a different state when replaying the
traces than when capturing them. Some times it is desirable to
replay a trace without reproducing the original cache state
precisely; this is useful, for example, when replaying a trace under
different hardware conditions (e.g., for benchmarking).
However, sometimes (e.g., for debugging or forensics) it is desirable
to reproduce the lower file system behavior as close to the original
as possible. Therefore, Replayfs supports three replaying modes for
dealing with read operations. First, reads are performed according
to the current cache state.
In particular, Replayfs calls all the captured buffer read operations.
In this case, only non-cached data pages result in calls to
page-based read operations.
Second, reads are performed according
to the original cache state. Here, reads are invoked on the page
level only for the pages that were not found in the cache during
tracing. Third, reads are not replayed at all. This is useful for
recreation of the resulting disk state as fast as possible.
Directory entries may be released from the dentry
cache during the replaying process but stay in during the trace
capture.
This can result in an inconsistency between the RAT entries
and the actual dentries.
To avoid this situation we force the dentries that stayed in
the cache during the capture to stay in the cache during
the replaying process:
we increase a dentry's reference counter every time it is
looked up and decrease it when dentries were released
according to the original trace.
2.6 Asynchronous File System Activity
Some of the file system activity is performed asynchronously by a
background thread.
Replaying asynchronous activity is complicated because
it is intertwined with file system internals.
For example, access-time updates may be supported on the
file system used for replaying but not be supported on the original one.
Therefore, Replayfs replays such activity indirectly:
the meta-data information is updated on time
according to the trace data but it is up to the lower file system
how and when to write the corresponding changes to stable storage.
This way the replaying process exercises the lower file system without
enforcing restrictions that are related only to the originally
traced file system.
2.7 Initial File System State
In the simplest case, a trace can be captured starting with an empty
file system and then replayed over an empty file system.
However, traces usually contain operations on files and other file
system objects which existed before the tracing
process was started.
Therefore, a file system must be prepared before the replaying may begin.
It is convenient to prepare the file system using the information
contained in the trace.
However, the best way to prepare the lower file system is
snapshotting [26,13,39].
Full restoration of the initial file system state makes trace
replaying more precise because many file system algorithms have
different performance with different file system states.
For example, directory sizes may influence the performance
of LOOKUP and READDIR operations
even if most of the files in the directory never show up in a trace.
Existing snapshotting systems can capture and restore snapshots
for Replayfs.
3 Implementation
Before a file system trace can be precisely replayed, it has to be captured
without perturbing the behavior of the lower file system.
Therefore, we performed several optimizations in Tracefs.
Traditionally, stackable file systems buffer data twice.
This allows them to keep both modified (e.g., encrypted or compressed)
and unmodified data in memory at the same time
and thus save considerable amounts of CPU time and I/O.
However, Tracefs does not modify the data pages.
Therefore, double caching does not provide any benefits but
makes the page cache size effectively half its original size.
The data is copied from one layer to the other,
unnecessarily consuming CPU resources.
Unfortunately, the Linux VFS architecture imposes constraints that
make sharing data pages between lower and upper layers complicated.
In particular, a data page is a VFS object that belongs to a
single inode and uses the information of that inode at the
same time [12].
We applied a solution used in RAIF [15].
Specifically, data pages that belong to the upper inode are
assigned to lower-level inodes for the short duration of the
lower-level page-based operations.
We tested the resulting Tracefs
stackable file system on a single-CPU
and on multi-CPU machines under compile and I/O-intensive workloads.
In addition to the CPU time and memory savings, this optimization allowed
us to reduce the Tracefs source size by about 250 lines.
In most cases, Replayfs does not need the original data buffers
for replaying READ operations.
Even for data verification purposes, an MD5 checksum is sufficient.
Therefore, we added a new Tracefs option that instructs it to capture
the data buffers for writing operations but not for reads.
This allowed us to reduce both the Tracefs trace sizes and the Tracefs
system time overheads.
Trace compiler
The trace compiler is optimized for performance.
Its intermediate data sets are commonly larger than the amount of the
available memory.
Therefore, we added several hash data structures
to avoid repeatedly scanning the data and thus reduce I/O usage.
We compare the buffers by comparing their MD5 checksums.
This allows us to save the CPU time because
MD5 checksums are calculated only once for every buffer.
The trace compiler consists of 4,867 lines of C code.
Replayfs kernel module
Because the trace compiler prepares the data for replaying,
Replayfs itself is relatively small and simple.
It consists of thread management, timing control,
trace prefetching and eviction, operation invocation, and VFS
resource-management components.
Replayfs's C source is 3,321 lines long.
Replayfs supports accelerated or decelerated playback by a fixed
factor, as well
as replaying as fast as possible.
Both Replayfs and Tracefs are implemented as loadable kernel modules.
We have ported Tracefs to the 2.6 Linux kernel and now
both Tracefs and Replayfs can be used on either 2.4 or 2.6
Linux kernels.
4 Evaluation
We conducted our benchmarks on a 1.7GHz Pentium 4 machine with 1GB
of RAM.
Its system disk was a 30GB 7200 RPM Western Digital Caviar IDE
formatted with Ext3. In addition,
the machine
had two Maxtor Atlas 15,000 RPM
18.4GB Ultra320 SCSI disks formatted with Ext2.
We used one of the SCSI disks for storing the traces
and the Replayfs traces; we used the other disk
for running the test workloads and replaying them.
We remounted the lower file systems before every benchmark run to
purge file system caches.
We ran each test at least ten times and used the
Student-t distribution to compute the 95% confidence
intervals for the mean elapsed, system, user, and wait times.
Wait time is the elapsed
time less CPU time used and consists mostly of I/O, but process
scheduling can also affect it.
In each case, the half-widths of the
confidence intervals were less than 5% of the mean.
The test machine was running a Fedora Core 3 Linux distribution
with a vanilla 2.6.11 kernel.
4.1 Evaluation Tools and Workloads
We created one additional statistics module, for evaluation purposes
only: this module records the timeline statistics from Ext2 and the
timing-deviation figures from Replayfs. This module uses the
/proc interface to export the data to the user-level for
analysis and plotting.
The statistics module stores the resulting information in a static
array and the only effects to a file-system operation are querying the
time and incrementing a value in the output array. Therefore, the
corresponding overheads were negligible: we measured them to be below
1% of the CPU time for all the experiments we ran.
Am-utils build
Building Am-utils is a CPU-intensive benchmark. We used Am-utils
6.1 [25]: it contains over 60,000 lines of C code in 430
files. The build process begins by running several hundred small
configuration tests to detect system features. It then builds a
shared library, ten binaries, four scripts, and documentation: a total
of 152 new files and 19 new directories.
Though the Am-utils compile is CPU intensive, it contains a fair mix
of file system operations.
According to the instrumented Ext2 file system, it uses
25% writes, 22% lseek operations, 20.5% reads, 10% open
operations, 10% close operations, and the remaining operations
are a mix of READDIR, LOOKUP, etc.
We used Am-utils because its activity is not uniform:
bursts of I/O activity are separated by intervals of high CPU activity
related to the user mode computations.
This allows us to analyze the replaying precision visually.
Also, the compilation process heavily uses the
memory-mapped operations.
Postmark
Postmark v1.5 [16] simulates the operation of
electronic mail servers. It performs a series of file system
operations such as appends, file reads, creations, and deletions.
This benchmark uses little CPU but is I/O intensive. We configured
Postmark to create 20,000 files, between 512-10K bytes in size, and
perform 200,000 transactions. We selected the create, delete,
read, and write operations with equal probability. We used Postmark
with this particular configuration because it stresses Replayfs under
a heavy load of I/O-intensive operations.
Pread
Pread is a small micro-benchmark we use to evaluate Replayfs's CPU
time consumption. It spawns two threads that concurrently read 1KB
buffers of cached data using the pread system call.
In every experiment, Pread performed 100 million read operations.
We use Pread to compare our results with
Buttress [1], a state-of-the-art system call
replayer that also used pread. This micro-benchmark also
allowed us to demonstrate the benefits of our zero-copying replaying.
4.2 Memory Overheads
The memory consumed by replayers effectively reduces the file system
cache sizes and therefore can affect the behavior of the lower file
system.
The compiled binary module sizes are negligible.
They are 29KB for the Replayfs module and 3KB for
the statistics module.
Our user mode trace compiler reduces the trace size by generating the
variable length program elements and by eliminating duplicate data
buffers. Table 2 shows some characteristics
of the raw and compiled traces as well as their compilation times. We
can see that the original Am-utils trace size was reduced by 56%, by 70%
for Postmark, and by 45% for Pread. Recall that only the RAT is
entirely kept in memory and its size was small for all the
traces we used. The program and the buffers trace components are
prefetched on demand.
We used a separate disk for storing the traces. This reduced
I/O contention and allowed us to prefetch the minimal amount of data
that is necessary to replay the trace on time. In addition, direct
access to the page cache allowed us to promptly evict pages that will
not be accessed in the near future. As a result, the memory used for
prefetching and storing the traces never exceeded 16MB for all of our
experiments. This means that all the Replayfs memory overheads together
were less than 2% of the available memory on our test
machine during any time of our benchmark runs.
| Am-utils | Postmark | Pread |
| Raw trace | 334 MB | 3,514 MB | 7,248 MB |
| Commands | 25 MB | 224 MB | 4,000 MB |
| RAT | 0.4 MB | 3.3 MB | 60 bytes |
| Buffers | 122 MB | 832 MB | 3 bytes |
| Compilation | < 1 | 15 | 31 |
| time (minutes) | | | |
Table 2: Size and compilation time of the traces.
4.3 Timing Precision of Replaying
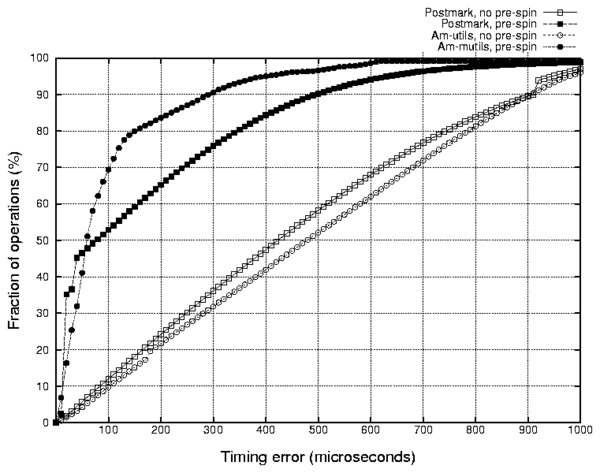 Figure 6: Cumulative distribution functions of
the event invocation error rates during several
replaying experiments.
The closer the curve is to the upper-left corner,
the better the average accuracy is.
Standard OS timers usually have low resolution.
For example, standard Linux timers have a resolution of one millisecond
which is much larger than a microsecond, the typical duration of a file
system operation that does not result in I/O.
We have applied the pre-spin technique [9]
described in Section 2 to bring
the timing accuracy to the microsecond scale.
Figure 6 shows the cumulative distribution function
(CDF) of the operation invocation timing errors.
Naturally, the timing errors of a Postmark run with no pre-spin are
distributed almost equally between 0 and 1 millisecond
because events are triggered with the poor millisecond resolution.
We can see that pre-spinning dramatically decreases the error values.
However, the error distributions differ for different workloads.
Two figures clarify this behavior.
Figure 7
shows the average timing error during every second of the
Am-utils trace replaying.
Figure 8
shows the corresponding file system
operation counts recorded by the instrumented Ext2.
We can see a clear correlation between the replaying event
rates and the related average error.
The reason behind this correlation is that
events well spaced apart are replayed with high accuracy,
whereas events that should be invoked close to each other
cannot be invoked as accurately because of the I/O and CPU time
overheads.
Therefore, we can make two conclusions.
Figure 6: Cumulative distribution functions of
the event invocation error rates during several
replaying experiments.
The closer the curve is to the upper-left corner,
the better the average accuracy is.
Standard OS timers usually have low resolution.
For example, standard Linux timers have a resolution of one millisecond
which is much larger than a microsecond, the typical duration of a file
system operation that does not result in I/O.
We have applied the pre-spin technique [9]
described in Section 2 to bring
the timing accuracy to the microsecond scale.
Figure 6 shows the cumulative distribution function
(CDF) of the operation invocation timing errors.
Naturally, the timing errors of a Postmark run with no pre-spin are
distributed almost equally between 0 and 1 millisecond
because events are triggered with the poor millisecond resolution.
We can see that pre-spinning dramatically decreases the error values.
However, the error distributions differ for different workloads.
Two figures clarify this behavior.
Figure 7
shows the average timing error during every second of the
Am-utils trace replaying.
Figure 8
shows the corresponding file system
operation counts recorded by the instrumented Ext2.
We can see a clear correlation between the replaying event
rates and the related average error.
The reason behind this correlation is that
events well spaced apart are replayed with high accuracy,
whereas events that should be invoked close to each other
cannot be invoked as accurately because of the I/O and CPU time
overheads.
Therefore, we can make two conclusions.
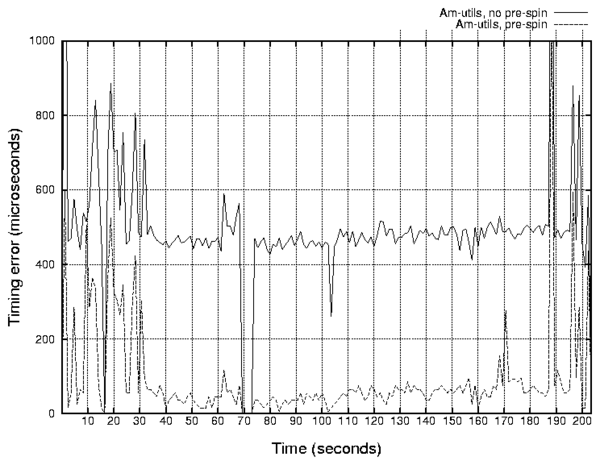 Figure 7: Dependence of the average invocation time error on
elapsed time during the Am-utils trace replaying.
First, the CDF of invocation errors
can easily hide real replaying problems.
For example, a CDF captured with a slow operation rate
workload may
indicate that almost all of the operations were replayed
with high precision.
However, Figure 6 shows that no information can
be inferred about how the same tool
would behave at medium or high I/O rates.
Second, the timers' accuracy is not as important for file system
activity replayers as it was believed
before [9,1].
The timer's resolution contributes
to the event invocation errors only at the low event rates where
timing precision is not even necessary.
On one hand, it is unlikely that events separated by long intervals of no
file system activity (as long as several durations of an average event)
will influence each other too much.
On the other hand, file system operations invoked close to each other, and
especially if they are invoked by different processes and they overlap,
are more likely to interfere with each other.
Therefore, it is desirable to replay them as precisely as possible.
However, in that case the timer's
resolution has small overall impact on the resulting timing quality.
Instead, the overheads that replayers add between operations define
the timing precision as we discussed in Section 2. We
can see that in Figure 8 by comparing the traces
of an Am-utils replayed with different timer resolutions.
We cannot easily see the pre-spinning improvement effects in
Figure 8, because they are only visible at the
micro-second resolution; Figure 6 shows our pre-spinning
improvements more prominently. However, we can see from
Figure 8 that in both
timer resolution cases
there are small discrepancies at the peaks of activity between
the replayed and captured traces.
One may assume that an increase in the CPU speed
can solve the timing precision problem. This is indeed
the case for network packet and network file system replayers because
the replayer and the target system run on different machines.
However, this is not the case for non-network file system replayers
because they execute on the same machine as the tested file system.
Therefore, with a faster CPU, the replayed operations will also
execute faster and their corresponding interactions will change
disproportionally; that is the portion of the CPU time
spent servicing file system requests will decrease and
requests from different processes will overlap less,
thus processes will
compete less for locks or disk heads.
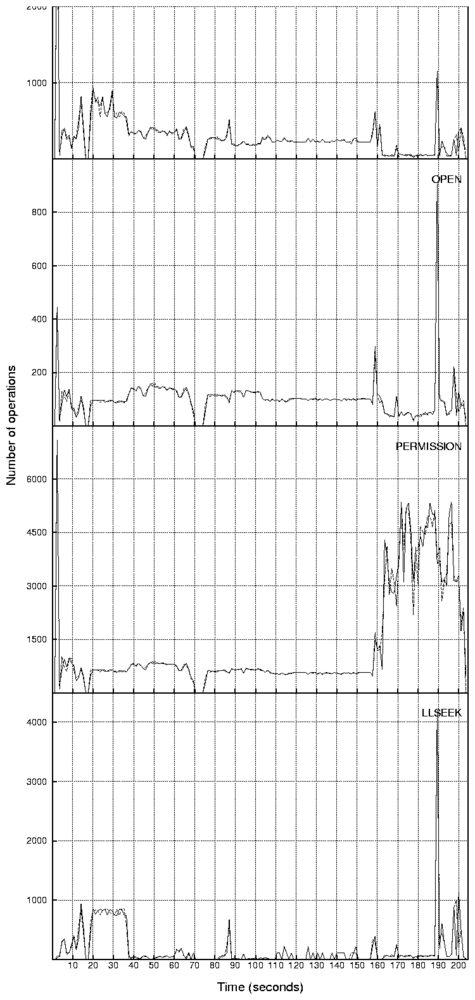
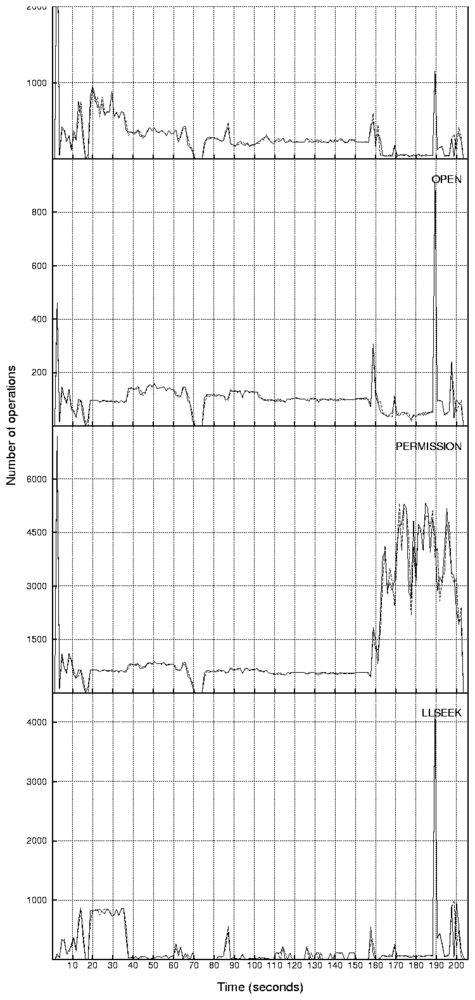
Figure 8: Counts of the file system operations as seen
by the lower Ext2 file system while replaying the
Am-utils traces without the pre-spin timer enhancement
(top)
and with the pre-spin enhancement
(bottom).
As we can see, there is no clear difference between
the two on the seconds scale in spite of the fact that
timing on the micro-second scale
is better with the pre-spin configuration.
In most cases the Replayfs and Tracefs curves overlap
and are indistinguishable.
Small timing discrepancies are correlated
with peaks of I/O activity.
We show four operations with the highest peaks of activity
( 800 operations)
because they have the highest timing errors observed.
Also, we do not show the RELEASE and COMMIT_WRITE
operations because their graphs closely resemble the
shapes of the OPEN and PRPARE_WRITE operations, respectively.
Figure 7: Dependence of the average invocation time error on
elapsed time during the Am-utils trace replaying.
First, the CDF of invocation errors
can easily hide real replaying problems.
For example, a CDF captured with a slow operation rate
workload may
indicate that almost all of the operations were replayed
with high precision.
However, Figure 6 shows that no information can
be inferred about how the same tool
would behave at medium or high I/O rates.
Second, the timers' accuracy is not as important for file system
activity replayers as it was believed
before [9,1].
The timer's resolution contributes
to the event invocation errors only at the low event rates where
timing precision is not even necessary.
On one hand, it is unlikely that events separated by long intervals of no
file system activity (as long as several durations of an average event)
will influence each other too much.
On the other hand, file system operations invoked close to each other, and
especially if they are invoked by different processes and they overlap,
are more likely to interfere with each other.
Therefore, it is desirable to replay them as precisely as possible.
However, in that case the timer's
resolution has small overall impact on the resulting timing quality.
Instead, the overheads that replayers add between operations define
the timing precision as we discussed in Section 2. We
can see that in Figure 8 by comparing the traces
of an Am-utils replayed with different timer resolutions.
We cannot easily see the pre-spinning improvement effects in
Figure 8, because they are only visible at the
micro-second resolution; Figure 6 shows our pre-spinning
improvements more prominently. However, we can see from
Figure 8 that in both
timer resolution cases
there are small discrepancies at the peaks of activity between
the replayed and captured traces.
One may assume that an increase in the CPU speed
can solve the timing precision problem. This is indeed
the case for network packet and network file system replayers because
the replayer and the target system run on different machines.
However, this is not the case for non-network file system replayers
because they execute on the same machine as the tested file system.
Therefore, with a faster CPU, the replayed operations will also
execute faster and their corresponding interactions will change
disproportionally; that is the portion of the CPU time
spent servicing file system requests will decrease and
requests from different processes will overlap less,
thus processes will
compete less for locks or disk heads.
Figure 8: Counts of the file system operations as seen
by the lower Ext2 file system while replaying the
Am-utils traces without the pre-spin timer enhancement
(top)
and with the pre-spin enhancement
(bottom).
As we can see, there is no clear difference between
the two on the seconds scale in spite of the fact that
timing on the micro-second scale
is better with the pre-spin configuration.
In most cases the Replayfs and Tracefs curves overlap
and are indistinguishable.
Small timing discrepancies are correlated
with peaks of I/O activity.
We show four operations with the highest peaks of activity
( 800 operations)
because they have the highest timing errors observed.
Also, we do not show the RELEASE and COMMIT_WRITE
operations because their graphs closely resemble the
shapes of the OPEN and PRPARE_WRITE operations, respectively.
4.4 CPU Time Consumption
System-call replaying tools run in user mode and invoke the same
system calls that were invoked by the original user programs. Usually
user-level replayers have CPU time overheads that are higher than the user
activity intervals in the original trace. Replayfs runs in the kernel
and therefore avoids wasting time on some of the operations required to cross
the user-kernel boundary.
Let us consider the pread system call. After it is invoked, the VFS
converts the file descriptor number to an in-kernel file structure,
checks parameters for validity and correspondence with the file type,
and verifies that the buffer can be used for writing.
Replayfs benefits from the following four optimizations: (1)
kernel mode VFS objects are readily available to Replayfs and need not
be looked up; (2) Replayfs operates on VFS objects directly and the
file structure argument is taken directly by looking up the RAT; (3)
parameters and file access modes were checked during the trace capture
and can be skipped; and (4) memory buffers are not passed from the
user space, so Replayfs can allocate them directly without having to
verify them.
Figure 9 shows the times related to the execution of the
original Pread program and replaying its trace by Replayfs at
full speed.
The Replayfs bar in Figure 9 shows that
skipping the VFS operations described above allows Replayfs to replay
the Pread trace 32% faster than the original program
generated it on the same hardware.
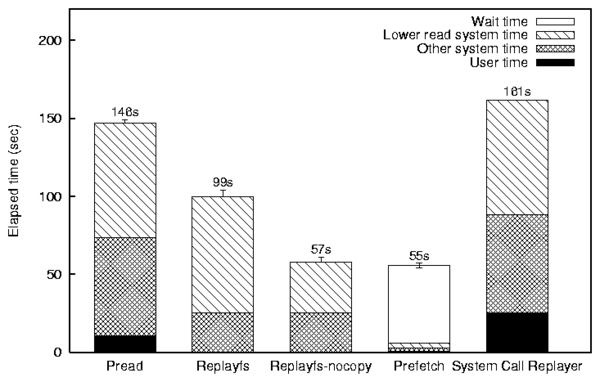 Figure 9: Elapsed times of our Pread
program (Pread),
the Pread trace replayed by Replayfs while
copying the data just read (Replayfs),
elapsed time of the
Pread trace replayed by a Replayfs that skips the
data copying (Replayfs-nocopy),
the time necessary to read the trace data as fast as possible
(Prefetch),
and estimated elapsed time of the system call
replayer with a 10% user time overhead
(System Call Replayer)
Replayfs can also avoid copying data between user-mode buffers and
the kernel pages.
The Replayfs-nocopy bar in Figure 9 demonstrates that
Replayfs can replay the original Pread trace 61% (2.5 times) faster
than the original program generated it on the same hardware.
We can see that the data copying alone can reduce the execution of the
file system read operation by 55% (685 out of 1,240 CPU cycles on average).
In the case of the Pread trace, no prefetching of data was necessary
(except for 3 bytes of null-terminated file name).
We created a modified version of the Pread program we call
Prefetch that sequentially reads data from a file as fast as possible.
It took Prefetch 55 seconds on average to read the Pread program
trace component.
The Prefetch bar in Figure 9 shows
that out of these 55 seconds, 49 were spent waiting for I/O completion.
This means that the replaying process was not I/O-bound
because Replayfs prefetches traces asynchronously.
However, a further decrease of the Replayfs CPU overheads may make Replayfs
I/O-bound while replaying the Pread trace: Replayfs would reach the
physical limitations of the I/O hardware and the disks, at which point
replaying could not be sped up further.
In that case, this problem can be resolved by replacing the disk drive
or its controller because the tested file system and the Replayfs traces
are located on different physical drives.
We compared Replayfs with the state-of-the-art Buttress system call
replayer. Unfortunately, Buttress availability for public, especially
for comparison purposes, is limited
and we could not evaluate it. Its overheads under the
Pread workload are reported to be 10% [1].
The rightmost bar in Figure 9 represents an extrapolated
timing result for Buttress; for visual comparison purposes, we
created that bar by adding 10%
overhead of the elapsed time to the user time of the original
Pread program time.
Note that the actual overhead value is not as important as the fact
that the overhead is positive.
Because the overhead is positive, user-level replayers
cannot replay traces like Pread at the same rate as
the original Pread program can issue I/O requests.
Having low or even negative overheads in Replayfs results in good
reproduction of the original timing conditions. Despite some existing
discrepancies between the original traces and the replayed ones (seen
in Figure 8), the replayed and the original
figures overlap for most of the operations even during peaks of
activity. Existing system call replaying tools such as Buttress
cannot match the trace as closely because of their inherent overheads.
Buttress is a well designed system;
its overheads are lower than the overheads of other published systems
that replay traces via system calls. However, it is precisely because
Buttress and similar systems run in the user level that they have
higher overheads, which in turn imposes greater limitations on their
ability to replay traces accurately.
Another benefit of Replayfs's low overheads is the ability to replay the
original traces at faster speeds even on the same hardware.
As we described above, we can replay read-intensive traces 2.5 times
faster than their original time.
In addition, we replayed the
Am-utils trace in the accelerated mode.
We were able to replay the 210-second long Am-utils trace
in under 6 seconds, reproducing all the memory-mapped and
other disk state changing operations.
This represents a speedup of more than two orders of magnitude.
Figure 9: Elapsed times of our Pread
program (Pread),
the Pread trace replayed by Replayfs while
copying the data just read (Replayfs),
elapsed time of the
Pread trace replayed by a Replayfs that skips the
data copying (Replayfs-nocopy),
the time necessary to read the trace data as fast as possible
(Prefetch),
and estimated elapsed time of the system call
replayer with a 10% user time overhead
(System Call Replayer)
Replayfs can also avoid copying data between user-mode buffers and
the kernel pages.
The Replayfs-nocopy bar in Figure 9 demonstrates that
Replayfs can replay the original Pread trace 61% (2.5 times) faster
than the original program generated it on the same hardware.
We can see that the data copying alone can reduce the execution of the
file system read operation by 55% (685 out of 1,240 CPU cycles on average).
In the case of the Pread trace, no prefetching of data was necessary
(except for 3 bytes of null-terminated file name).
We created a modified version of the Pread program we call
Prefetch that sequentially reads data from a file as fast as possible.
It took Prefetch 55 seconds on average to read the Pread program
trace component.
The Prefetch bar in Figure 9 shows
that out of these 55 seconds, 49 were spent waiting for I/O completion.
This means that the replaying process was not I/O-bound
because Replayfs prefetches traces asynchronously.
However, a further decrease of the Replayfs CPU overheads may make Replayfs
I/O-bound while replaying the Pread trace: Replayfs would reach the
physical limitations of the I/O hardware and the disks, at which point
replaying could not be sped up further.
In that case, this problem can be resolved by replacing the disk drive
or its controller because the tested file system and the Replayfs traces
are located on different physical drives.
We compared Replayfs with the state-of-the-art Buttress system call
replayer. Unfortunately, Buttress availability for public, especially
for comparison purposes, is limited
and we could not evaluate it. Its overheads under the
Pread workload are reported to be 10% [1].
The rightmost bar in Figure 9 represents an extrapolated
timing result for Buttress; for visual comparison purposes, we
created that bar by adding 10%
overhead of the elapsed time to the user time of the original
Pread program time.
Note that the actual overhead value is not as important as the fact
that the overhead is positive.
Because the overhead is positive, user-level replayers
cannot replay traces like Pread at the same rate as
the original Pread program can issue I/O requests.
Having low or even negative overheads in Replayfs results in good
reproduction of the original timing conditions. Despite some existing
discrepancies between the original traces and the replayed ones (seen
in Figure 8), the replayed and the original
figures overlap for most of the operations even during peaks of
activity. Existing system call replaying tools such as Buttress
cannot match the trace as closely because of their inherent overheads.
Buttress is a well designed system;
its overheads are lower than the overheads of other published systems
that replay traces via system calls. However, it is precisely because
Buttress and similar systems run in the user level that they have
higher overheads, which in turn imposes greater limitations on their
ability to replay traces accurately.
Another benefit of Replayfs's low overheads is the ability to replay the
original traces at faster speeds even on the same hardware.
As we described above, we can replay read-intensive traces 2.5 times
faster than their original time.
In addition, we replayed the
Am-utils trace in the accelerated mode.
We were able to replay the 210-second long Am-utils trace
in under 6 seconds, reproducing all the memory-mapped and
other disk state changing operations.
This represents a speedup of more than two orders of magnitude.
5 Related Work
Trace capture and replaying have been used for decades
and we describe only a representative set of papers related
to file system activity tracing and replaying.
Capturing traces
We describe tracers according to the level of abstraction
where they capture the file system activity:
system-call-level tracers,
virtual file system level tracers,
network tracers,
and finally driver-level tracers.
We discuss them in this order because network-level tracers capture
file system information at a level of abstraction that is
higher than the driver-level, but is lower than the VFS-level.
- The most common tool used to capture system calls
is strace [38]. It uses the ptrace system call to
capture the sequence of system calls invoked by an application
together with associated parameter values. DFSTrace
showed that special measures have to be taken to collect file system
traces in distributed environments during long intervals of time, to
minimize the volume of generated and transferred
data [19]. The problem of missed memory-mapped operations
in system call traces has long been recognized [22].
However, only in 2000 did
Roselli show that unlike decades ago, memory-mapped I/O
operations are now more common than normal reads and
writes [29].
- Others collected traces at the virtual file system
level for Linux [2] and Windows
NT [37,29]; these traces include
memory-mapped operations.
- Network packet traces can be collected using
specialized devices or software tools like
tcpdump [11]. Specialized tools can capture and
preprocess only the network file system related
packets [8,4]. Network file
system traces do not contain information about the requests satisfied
from the caches but can contain information about multiple hosts.
- Driver-level traces contain only the requests that are not
satisfied from the caches.
This is useful when disk layout information needs to be collected
while minimizing the trace size [30].
Trace replaying
Similar to capturing traces,
replaying traces is performed at several logical levels.
Usually, the traces are replayed at the same level that they
were captured from.
This way changes to the timing and operations mix are minimized.
However, for simplicity, some authors replay kernel-level
traces at the user level.
- It is simple to replay system calls that contain all the necessary
information as parameters.
Several existing system call replayers are designed specifically to
replay file system activity. Buttress [1]
and DFSTrace [19] can replay system call traces
from the user level. Buttress's evaluation showed a 10% slowdown if
replaying traces at high I/O rates, which the authors claimed was
"accurate enough."
Performance data for
DFSTrace's replaying mode is not available, mostly because the main
focus of the authors was on capturing traces.
- Network traffic replayers operate in user mode and can replay
arbitrary network traces [9,33].
Network file system trace replaying is conceptually similar to
ordinary network packet trace replaying. However, knowledge of the
network file system protocol details allows replayers to reorder some
packets for faster replaying [42]. Replayers and
tracers can run on dedicated machines separate from the tested
servers. Thus, network file system trace replaying is the least
intrusive replaying and capturing method.
- Replaying I/O patterns at the disk-driver level allows
the evaluation of elevator algorithms and driver subsystems with lower
overheads and little complexity. Also, it allows the evaluation of disk
layouts. For example, Prabhakaran et al. used a driver level replayer
to measure the effects of the journal file relocation on the
disk [27]. In this particular case,
system-call-level replaying was not appropriate because the physical
file's location on the disk could not be easily controlled from the
user level.
- Others capture and then replay traces at different logical levels.
For example, Drive-Thru [24]
processes driver-level traces and replays them at the system-call
level to evaluate power consumption.
Unrelated file system operations are removed during the preprocessing
phase to speed up the replaying process.
Several others replayed network file system traces in disk simulators
for benchmarking [36,41].
Network traces are most suitable for this purpose because they are captured
below caches and thus minimally disturb the workload.
File system state versioning
File system trace replaying can be considered a form of fine-grained
versioning [32,20].
Replaying can reproduce the version of the file system state including
possible state abnormalities caused by timing conditions.
This property is useful for forensics (post-attack
investigation) and debugging purposes.
Also, it can be used to emulate the aging of a file system
before running actual benchmarks [31].
Before replaying file system activity, replayers may have to recreate
the pre-tracing file system image. This is important for accuracy:
file layouts and the age of the file system can affect its behavior
significantly. Some authors have opted to extrapolate the original
file system state based on information gleaned from the trace
alone [19,42]. This technique has three
disadvantages. First, full path name information is required in the
trace data to identify the exact directories in which files were
accessed [22]. Second, files that were not
accessed during the trace are not known to the system, and those files
could have affected the file system's layout and age. Third, several
trace-capture techniques omit information that is vital to replaying
accurately. For example, an NFS (v2 and v3) trace replayer that sees
an NFS_WRITE protocol message cannot tell if the file being
written to existed before or not. It is therefore our belief that the
best method to restore the pre-tracing file system state is to use
snapshotting [26,13,39].
Data prefetching
Data prefetching is a common technique to decrease application latency
and increase performance [3].
Future access patterns are normally inferred from a history of past accesses
or from hints provided by applications [34].
If access patterns are known in advance, two simple approaches
are possible. First, data can be aggressively read in advance
without overwriting the already prefetched data. Second,
data can be read just in time to avoid stalls. Cao et al. showed
that both approaches are at most two times worse than the optimal
solution [5]. Both algorithms have simple
implementations. The TIP2 system [23] uses a
version of the second algorithm called fixed horizon. A more
sophisticated reverse
aggressive [17] algorithm has
near-optimal performance but is difficult to implement. The
forestall [18] algorithm is an
attempt to combine the best of these algorithms: simplicity and
prefetching performance.
Timing inaccuracy
Existing system-call replayers suffer from
timing precision problems and peak-load reproduction problems to some
degree, for several reasons:
- User mode replayers have high memory and CPU overheads due to
redundant data copying between user and kernel
buffers [28].
-
Page eviction is not completely controlled from the user level
and thus prefetching policies are harder to enforce.
Nevertheless, the madvise interface can help somewhat to
control data page eviction [9].
-
Some kernels are not preemptive and have long
execution paths including in interrupt handlers [10].
-
Replaying processes can be preempted by other tasks.
This can be partially solved by instructing the
scheduler to treat the replaying process as real time
process [9].
-
Standard timer interfaces exposed to the user level are
not precise enough.
Several authors investigated this problem and came to similar
conclusion [9,1]:
it is sufficient to setup the timer early and busy-wait only after
the timer expires.
The metric used to evaluate the replaying precision in several papers
is the average difference between the actual event time and the traced
event time [9,1]. For example, using better
kernel timers and the madvise interface resulted in a typical
100-microsecond of difference [9]-almost a 100 times
improvement compared with a replayer without these
measures [33].
6 Conclusions
Trace replaying offers a number of advantages for file system
benchmarking, debugging, and forensics. To be effective and accurate,
file system traces should be captured and replayed as close as
possible to the file system code.
Existing systems that capture file system traces at the network file
system level often miss on client-side cached or aggregated events
that do not translate into protocol messages; system-call traces miss
the ever more popular memory-mapped reads and writes; and
device-driver level traces omit important meta-data file system events
such as those that involve file names.
These problems are exacerbated when traces that were captured at one
level are replayed at another: even more information loss results.
We demonstrated that unlike previously believed, the accuracy of
replaying high I/O-rate traces is limited by the overheads of the
replayers-not the precision of the timers.
Since most file systems run in the kernel, user-level file
system replayers suffer from overheads that affect their accuracy
significantly. User-mode replayers
produce an excessive number of context
switches and data copies across the user-kernel boundary.
Therefore, existing replayers are inaccurate and unable
to replay file system traces at high event rates.
We have designed, developed, and evaluated a new replaying system
called Replayfs, which replays file system traces immediately above
file systems, inside the kernel. We carefully chose which actions are
best done offline by our user-level trace compiler, or online by our
runtime kernel Replayfs module. Replaying so close to
the actual file system has three distinct benefits:
- First, we capture and replay all file system operations-including
important memory-mapped operations-resulting in more accurate
replaying.
-
Second, we have access to important internal kernel caches,
which allowed us to avoid unnecessary data copying, reduce the number
of context switches, and optimize trace data prefetching.
-
Third, we have precise control over thread
scheduling, allowing us to use the oft-wasted pre-spin periods more
productively-a technique we call productive pre-spin.
Our kernel-mode replayer is assisted by a user-mode trace compiler,
which takes portable traces generated by Tracefs, and produces a
binary replayable trace suitable for executing in the kernel. Our
trace compiler carefully partitions the data into three distinct
groups with different access patterns, which allowed us to apply
several optimizations aimed at improving performance:
- Commands
-
which are read sequentially;
- Resource Allocation Table (RAT)
-
which determines how in-memory resources are used throughout the
replaying phase. In particular, the RAT allows us to reuse resources
at replay time once they are no longer needed, rather than discarding
them;
- Buffers
-
which are bulk I/O data pages
and file names that are often accessed randomly
on a need basis.
This partitioning and the possibility to evict cached data pages
directly allowed us to reduce memory usage considerably: in
all of our experiments, Replayfs consumed no more than 16MB of kernel
memory, which is less than 2% on most modern systems.
Overall, Replayfs can replay traces faster than any known user-level
system, and can handle replaying of traces with spikes of I/O activity
or high rates of events. In fact, thanks to our optimizations,
Replayfs can replay traces captured on the same hardware-faster than
the original program that produced the trace.
6.1 Future Work
Commands executed by different threads may be issued out of their
original order. For example, if one thread is waiting for a long
I/O request, other threads may continue their execution unless
there is a dependency between requests.
This is useful for stress-testing and certain
benchmarking modes. However, commands have to be synchronized
at points where threads depend on each other.
For example, if an original trace shows that one thread read a file
after a second thread wrote the same file, then this ordering should
be preserved during trace replaying. We are modifying our existing
trace compiler to add thread synchronization commands to the commands
Replayfs trace component.
Some workloads may result in different behavior
of the file system even if the operations' order is preserved.
For example, two threads concurrently writing to the same file
may create a different output file due to in-kernel preemption.
Future policies will allow Replayfs
to differentiate between real replaying errors and tolerable
mismatches between return values due to race conditions.
There is a large body of existing traces which were captured over the
past decades on different systems or at different levels.
Unfortunately, many of these traces cannot be replayed for lack of
tools. We are currently developing user-mode translators which can
convert such traces from other formats into our own portable format.
We have carefully analyzed the VFS interfaces of Linux, FreeBSD,
Solaris, and Windows XP. Despite their significant internal
implementation differences, we found them to be remarkably similar in
functionality. This is primarily because file system interfaces have
evolved over time to cooperate best with APIs such as the POSIX
system-call standard. Therefore, we also plan to port Replayfs to
other operating systems.
7 Acknowledgments
We would like to acknowledge Akshat Aranya, Jordan Hoch, and Charles P. Wright for their help at different stages of Replayfs's design, development,
and testing. We would also like to thank all FSL members for their support
and a productive environment.
This work was partially made possible by NSF
awards EIA-0133589 (CAREER) and CCR-0310493, and HP/Intel gifts numbers
87128 and 88415.1.
References
- [1]
-
E. Anderson, M. Kallahalla, M. Uysal, and R. Swaminathan.
Buttress: A Toolkit for Flexible and High Fidelity I/O
Benchmarking.
In Proceedings of the Third USENIX Conference on File and
Storage Technologies (FAST 2004), pages 45-58, San Francisco, CA,
March/April 2004.
- [2]
-
A. Aranya, C. P. Wright, and E. Zadok.
Tracefs: A File System to Trace Them All.
In Proceedings of the Third USENIX Conference on File and
Storage Technologies (FAST 2004), pages 129-143, San Francisco, CA,
March/April 2004.
- [3]
-
L. Belady.
A Study of Replacement Algorithms for Virtual Storage Computers.
IBM Systems Journal, 5(2):78-101, 1966.
- [4]
-
M. Blaze.
NFS Tracing by Passive Network Monitoring.
In Proceedings of the USENIX Winter Conference, San Francisco,
CA, January 1992.
- [5]
-
P. Cao, E. Felten, A. Karlin, and K. Li.
A Study of Integrated Prefetching and Caching Strategies.
In Proceedings of the 1995 ACM SIGMETRICS Conference on
Measurement and Modeling of Computer Systems, pages 188-197, Ottawa,
Canada, May 1995.
- [6]
-
P. M. Chen and D. A. Patterson.
A New Approach to I/O Performance Evaluation - Self-Scaling I/O
Benchmarks, Predicted I/O Performance.
In Proceedings of the 1993 ACM SIGMETRICS International
Conference on Measurement and Modeling of Computer Systems, pages 1-12,
Seattle, WA, May 1993.
- [7]
-
F. Cornelis, M. Ronsse, and K. Bosschere.
Tornado: A novel input replay tool.
In Proceedings of the 2003 International Conference on Parallel
and Distributed Processing Techniques and Applications (PDPTA`03), volume 4,
pages 1598-1604, Las Vegas, Nevada, June 2003.
- [8]
-
D. Ellard and M. Seltzer.
New NFS Tracing Tools and Techniques for System Analysis.
In Proceedings of the Annual USENIX Conference on Large
Installation Systems Administration, San Diego, CA, October 2003.
- [9]
-
W. Feng, A. Goel, A. Bezzaz, W. Feng, and J. Walpole.
Tcpivo: a high-performance packet replay engine.
In Proceedings of the ACM SIGCOMM workshop on Models, methods
and tools for reproducible network research, pages 57-64, Karlsruhe,
Germany, 2003.
- [10]
-
A. Goel, L. Abeni, J. Snow, C. Krasic, and J. Walpole.
Supporting Time-Sensitive Applications on General-Purpose Operating
Systems.
In Proceedings of the Fifth Symposium on Operating System Design
and Implementation (OSDI '02), pages 165-180, Boston, MA, December 2002.
- [11]
-
LBNL Network Research Group.
The TCPDump/Libpcap site.
www.tcpdump.org, February 2003.
- [12]
-
J. S. Heidemann and G. J. Popek.
Performance of cache coherence in stackable filing.
In Proceedings of Fifteenth ACM Symposium on Operating Systems
Principles (SOSP '95), pages 3-6, Copper Mountain Resort, CO, December
1995.
- [13]
-
D. Hitz, J. Lau, and M. Malcolm.
File System Design for an NFS File Server Appliance.
In Proceedings of the USENIX Winter Technical Conference, pages
235-245, San Francisco, CA, January 1994.
- [14]
-
J. H. Howard, M. L. Kazar, S. G. Menees, D. A. Nichols,
M. Satyanarayanan, R. N. Sidebotham, and M J. West.
Scale and performance in a distributed file system.
ACM Transactions on Computer Systems, 6(1):51-81, February
1988.
- [15]
-
N. Joukov, A. Rai, and E. Zadok.
Increasing distributed storage survivability with a stackable
raid-like file system.
In Proceedings of the 2005 IEEE/ACM Workshop on Cluster
Security, in conjunction with the Fifth IEEE/ACM International Symposium on
Cluster Computing and the Grid (CCGrid 2005), Cardiff, UK, May 2005
(Won best paper award).
- [16]
-
J. Katcher.
PostMark: A New Filesystem Benchmark.
Technical Report TR3022, Network Appliance, 1997.
www.netapp.com/tech_library/3022.html.
- [17]
-
T. Kimbrel and A. Karlin.
Near-optimal Parallel Prefetching and Caching.
In Proceedings of the 37th IEEE Symposium on Foundations of
Computer Science, pages 540-549, October 1996.
- [18]
-
T. Kimbrel, A. Tomkins, R. Patterson, B. Bershad, P. Cao, E. Felten, G. Gibson,
A. Karlin, and K. Li.
A Trace-Driven Comparison of Algorithms for Parallel Prefetching and
Caching.
In Proceedings of the Second Symposium on Operating Systems
Design and Implementation (OSDI 1996), pages 19-34, Seattle, WA, October
1996.
- [19]
-
L. Mummert and M. Satyanarayanan.
Long term distributed file reference tracing: Implementation and
experience.
Technical Report CMU-CS-94-213, Carnegie Mellon University,
Pittsburgh, PA, 1994.
- [20]
-
K. Muniswamy-Reddy, C. P. Wright, A. Himmer, and E. Zadok.
A Versatile and User-Oriented Versioning File System.
In Proceedings of the Third USENIX Conference on File and
Storage Technologies (FAST 2004), pages 115-128, San Francisco, CA,
March/April 2004.
- [21]
-
J. Ousterhout.
Why Threads are a Bad Idea (for most purposes).
In Invited Talk at the 1996 USENIX Technical Conference,
January 1996.
home.pacbell.net/ouster/threads.ppt.
- [22]
-
J. Ousterhout, H. Costa, D. Harrison, J. Kunze, M. Kupfer, and
J. Thompson.
A Trace-Driven Analysis of the UNIX 4.2 BSD File System.
In Proceedings of the Tenth ACM Symposium on Operating System
Principles, pages 15-24, Orcas Island, WA, December 1985
- [23]
-
R. Patterson, G. Gibson, E. Ginting, D. Stodolsky, and J. Zelenka.
Informed Prefetching and Caching.
In Proceedings of the 15th ACM Symposium on Operating System
Principles (SOSP '95), pages 79-95, Copper Mountain Resort, CO, December
1995.
- [24]
-
D. Peek and J. Flinn.
Drive-Thru: Fast, Accurate Evaluation of Storage Power Management.
In Proceedings of the Annual USENIX Technical Conference, pages
251-264, Anaheim, CA, April 2005.
- [25]
-
J. S. Pendry, N. Williams, and E. Zadok.
Am-utils User Manual, 6.1b3 edition, July 2003.
www.am-utils.org.
- [26]
-
Z. Peterson and R. Burns.
Ext3cow: a time-shifting file system for regulatory compliance.
Trans. Storage, 1(2):190-212, 2005.
- [27]
-
V. Prabhakaran, A. C. Arpaci-Dusseau, and R. H. Arpaci-Dussea.
Analysis and Evolution of Journaling File Systems.
In Proceedings of the Annual USENIX Technical Conference,
Anaheim, CA, May 2005.
- [28]
-
A. Purohit, J. Spadavecchia, C. Wright, and E. Zadok.
Improving Application Performance Through System Call Composition.
Technical Report FSL-02-01, Computer Science Department, Stony Brook
University, June 2003.
www.fsl.cs.sunysb.edu/docs/cosy-perf/.
- [29]
-
D. Roselli, J. R. Lorch, and T. E. Anderson.
A Comparison of File System Workloads.
In Proc. of the Annual USENIX Technical Conference, pages
41-54, San Diego, CA, June 2000.
- [30]
-
C. Ruemmler and J. Wilkes.
UNIX Disk Access Patterns.
In Proceedings of the Winter USENIX Technical Conference, pages
405-420, San Diego, CA, January 1993.
- [31]
-
K. A. Smith and M. I. Seltzer.
File System Aging - Increasing the Relevance of File System
Benchmarks.
In Proceedings of the 1997 ACM SIGMETRICS International
Conference on Measurement and Modeling of Computer Systems, pages 203-213,
Seattle, WA, June 1997.
- [32]
-
Craig A. N. Soules, Garth R. Goodson, John D. Strunk, and Gregory R. Ganger.
Metadata Efficiency in Versioning File Systems.
In Proceedings of the Second USENIX Conference on File and
Storage Technologies (FAST '03), pages 43-58, San Francisco, CA, March
2003.
- [33]
-
tcpreplay developers.
tcpreplay(8), February 2004.
tcpreplay.sourceforge.net.
- [34]
-
A. Tomkins, R. Patterson, and G. Gibson.
Informed Multi-Process Prefetching and Caching.
In Proceedings of the 1997 ACM SIGMETRICS Conference on
Measurement and Modeling of Computer Systems, pages 100-114, Seattle, WA,
June 1997.
- [35]
-
Transaction Processing Performance Council.
Transaction Processing Performance Council.
www.tpc.org, 2005.
- [36]
-
M. Uysal, A. Merchant, and G. A. Alvarez.
Using MEMS-Based Storage in Disk Arrays.
In Proceedings of the Second USENIX Conference on File and
Storage Technologies (FAST '03), pages 89-101, San Francisco, CA, March
2003.
- [37]
-
W. Vogels.
File System Usage in Windows NT 4.0.
In Proceedings of the 17th ACM Symposium on Operating Systems
Principles, pages 93-109, Charleston, SC, December 1999
- [38]
-
W. Akkerman.
strace software home page.
www.liacs.nl/~wichert/strace/, 2002.
- [39]
-
C. P. Wright, J. Dave, P. Gupta, H. Krishnan, E. Zadok, and M. N. Zubair.
Versatility and Unix Semantics in a Fan-Out Unification File
System.
Technical Report FSL-04-01b, Computer Science Department, Stony Brook
University, October 2004.
www.fsl.cs.sunysb.edu/docs/unionfs-tr/unionfs.pdf.
- [40]
-
E. Zadok and J. Nieh.
FiST: A Language for Stackable File Systems.
In Proc. of the Annual USENIX Technical Conference, pages
55-70, San Diego, CA, June 2000.
- [41]
-
C. Zhang, X. Yu, A. Krishnamurthy, and R. Y. Wang.
Configuring and Scheduling an Eager-Writing Disk Array for a
Transaction Processing Workload.
In Proceedings of the First USENIX Conference on File and
Storage Technologies (FAST 2002), pages 289-304, Monterey, CA, January
2002.
- [42]
-
N. Zhu, J. Chen, T. Chiueh, and D. Ellard.
Scalable and Accurate Trace Replay for File Server Evaluation.
Technical Report TR-153, Computer Science Department, Stony Brook
University, December 2004.
www.ecsl.cs.sunysb.edu/tr/TR153.pdf.
Footnotes:
1Appears in the proceedings of the Fourth USENIX Conference on File and Storage Technologies (FAST 2005)
File translated from
TEX
by
TTH,
version 3.70.
On 14 Oct 2005, 11:30.