DARC: Dynamic Analysis of Root Causes
of Latency Distributions

Avishay Traeger, Ivan Deras, and Erez Zadok
Computer Science Department, Stony Brook University
Stony Brook, NY, USA
{atraeger,iderashn,ezk}@cs.sunysb.edu

1

June 2008

Abstract

OSprof is a versatile, portable, and efficient profiling methodology based on the analysis of latency distributions. Although OSprof has offers several unique benefits and has been used to uncover several interesting performance problems, the latency distributions that it provides must be analyzed manually. These latency distributions are presented as histograms and contain distinct groups of data, called peaks, that characterize the overall behavior of the running code. By automating the analysis process, we make it easier to take advantage of OSprof's unique features.
We have developed the Dynamic Analysis of Root Causes system (DARC), which finds root cause paths in a running program's call-graph using runtime latency analysis. A root cause path is a call-path that starts at a given function and includes the largest latency contributors to a given peak. These paths are the main causes for the high-level behavior that is represented as a peak in an OSprof histogram. DARC performs PID and call-path filtering to reduce overheads and perturbations, and can handle recursive and indirect calls. DARC can analyze preemptive behavior and asynchronous call-paths, and can also resume its analysis from a previous state, which is useful when analyzing short-running programs or specific phases of a program's execution.
We present DARC and show its usefulness by analyzing behaviors that were observed in several interesting scenarios. We also show that DARC has negligible elapsed time overheads for normal use cases.

1  Introduction

An important goal of performance analysis is finding the root causes for some high-level behavior that a user observes. OSprof [8] presents these high-level behaviors to the user by collecting latency distributions for functions in histograms. These histogram profiles contain groups of operations, called peaks. Figure 1 shows example OSprof profiles for single and multiple processes calling the fork operation. We discuss this profile further in Section 2. For now, note that there are two distinct peaks in the multi-process profile (white bars): the first spans bins 15-19, and the second spans bins 20-25. These types of peaks are characteristic of OSprof profiles, and are indicative of some high-level behavior. In this case, the left peak characterizes the latency of the actual fork operation, and the right peak shows a lock contention.
These histogram profiles are presented to the user, and with OSprof, the user then manually analyzes the profiles using a variety of techniques. One technique is to compare peaks from two different profiles to reach some conclusion. To analyze the multi-process fork workload shown in the white bars of Figure 1, a user would need to have the expertise and insight to compare the profile to a single-process workload's profile. Because the right-most peak does not appear in the single-process profile, the user can guess that a lock contention caused the peak.
Despite the manual analysis required to analyze profiles, OSprof is a versatile, portable, and efficient profiling methodology. It includes features that are lacking in other profilers, such as the ability to collect time-lapse profiles, small profile sizes, and low overheads (in terms of time, memory usage, and code size).
We designed DARC (Dynamic Analysis or Root Causes) to remedy the problem of manual profile analysis. DARC dynamically instruments running code to find the functions that are the main latency contributors to a given peak in a given profile. We call these functions root causes. DARC's output is the call-paths that begin with the function being analyzed, and consist of root cause functions. This provides the user with the exact sequence of functions that were responsible for the peak of interest.
DARC can narrow down root causes to basic blocks and can analyze recursive code as well as code containing indirect functions. If the root cause of a peak is a preemptive event, DARC can determine the type of event (a disk interrupt, for example). DARC can also analyze asynchronous paths in the context of the main process. Although DARC generally does not require much time to perform its analysis, DARC may not be able to fully analyze programs with short runtimes, and longer running programs with short phases that are of interest. To solve these issues, DARC can resume its analysis from a previous point. The program can be run again, and the analysis continues from the previous point. To minimize false positives, DARC performs both process ID (PID) and call-path filtering. PID filtering ensures that only calls made by a specific process or thread group are analyzed. Call-path filtering ensures that DARC analyzes only calls which originate from the function of interest and proceed through root cause functions.
We implemented DARC and present several cases that show the advantages of automatic root cause analysis. Not only is DARC's analysis faster than manual analysis, but it also provides more definitive explanations than those obtained from manual analysis. We measured DARC's elapsed time overheads and show that they are negligible for normal usage. Although DARC can add approximately 4.9 times overhead to fast memory-bound operations, the analysis can be completed quickly, resulting in a negligible effect on overall elapsed time. Further, our instrumentation adds no noticeable overhead on slower I/O-bound operations.
The rest of the paper is organized as follows. We describe OSprof in Section 2. We detail our design in Section 3 and our implementation in Section 4. We discuss DARC's limitations in Section 5 and its parameters in Section 6. Section 7 describes our experimental setup. Section 8 shows examples of how DARC finds root causes. We evaluate DARC's performance in Section 9. We discuss related work in Section 10. We conclude and discuss future work in Section 11.

2  OSprof

OSprof [8] is a powerful profiling methodology. Latencies for a specified function are measured using the CPU cycle counter (TSC on x86) and presented in histogram form. OSprof measures latency using CPU cycles because it is a highly precise and efficient metric available at run-time. Figure 1 shows an actual profile of the FreeBSD 6.0 fork operation. The fork operation was called concurrently by one process (black bars) and by four processes (white bars) on a dual-CPU SMP system. The operation name is shown in the top right corner of the profile. The lower x-axis shows the bin (or bucket) numbers, which are calculated as the logarithm of the latency in CPU cycles. The y-axis shows the number of operations whose latency falls into a given bin. Note that both axes are logarithmic. For reference, the labels above the profile give the bins' average latency in seconds. In Figure 1, the two peaks in the multi-process histogram correspond to two paths of the fork operation: (1) the left peak corresponds to a path without lock contention, and (2) the right peak corresponds to a path with a lock contention. The methods used to reach this conclusion are described later in this section.
data/clone-freebsd.png
Figure 1: Profiles of FreeBSD 6.0 fork operations with single-process (black bars) and multi-process (white bars) workloads.
The relative simplicity of the profiling code makes OSprof highly portable. It has been used to find and diagnose interesting problems on Linux, FreeBSD, and Windows XP, and has been used to profile from user-space and at several kernel instrumentation points. OSprof can be used for gray-box OS profiling. For example, binary instrumentation was used to instrument Windows XP system calls. The latency distributions of these system calls included information about the Windows kernel. OSprof is also versatile: it can profile CPU time, I/O, locks, semaphores, interrupts, the scheduler, and networking protocols.
OSprof has negligible performance overheads. Its small profiles and code size minimize the effects on caches. Additionally, having small profiles enables OSprof to collect time-lapse profiles, where a separate profile is used for each time segment. This allows the user to see how latency distributions change over time. The performance overhead for profiling an operation is approximately 40 cycles per call. This is much faster than most measured functions, especially since OSprof is generally used to profile high-level functions.
The drawback of OSprof is the manual investigation required to find the root cause of a particular behavior, which is seen as a peak in a profile. The investigation typically requires some deep understanding of the code, as well as taking the time to profile more sections of code. Let us consider the profile shown in Figure 1 in more detail. In the single-process case, only the left-most peak is present. Therefore, it is reasonable to assume that there is some contention between processes inside of the fork function. In addition to the differential profile analysis technique used here, other techniques have also been used, such as using prior knowledge of latencies, layered profiling, correlating latencies to variables, and profile sampling [8]. We show some examples of these techniques in Section 8, where we compare the analysis methods of OSprof with DARC.

3  Design

We define a root cause function to be a function that is a major latency contributor to a given peak in an OSprof profile. The key to searching for root causes lies in the fact that latencies are additive: the latency of a function's execution is roughly equal to the latency of executing the function itself, plus the latency to execute its callees. This concept can be extended recursively to the entire call-graph, providing us with an effective method for finding the largest latency contributors. DARC searches the call-graph one level at a time, identifying the main latency contributors at each step, and further searching the sub-trees of those functions.
When starting DARC, the user specifies the process ID (PID) of the target program, the function to begin analyzing (we refer to this as f0), and the maximum search depth. We call a path from f0 to a root cause a root cause path. DARC's goal is to find root cause paths and present them to the user. Over time, DARC creates an in-memory tree that represents the function calls along root cause paths. We call this the Function Tree, or ftree, and it is composed of fnodes. Initially, there is a single fnode in the tree, representing calls to f0. The depth of the ftree increases during DARC's analysis, until either the specified maximum depth is reached, or DARC has finished its analysis. The PID is used to ensure that only function calls that are invoked on behalf of the given process or thread group are analyzed.
It is important to note that fnodes do not represent functions, but rather function calls in the context of call-paths. For example, if both fA and fB call fC, there would be two nodes for fC-one with fA as a parent, and one with fB as a parent. This concept also holds for situations where one function calls a different function twice. In this case, there will be one node for each call site. The ftree is a proper tree, as it contains only sequences of function calls, and so it does not contain loops or nodes with more than one parent. The ftree grows as DARC finds more functions that belong to root cause paths.
f0 {
    time1 = GET_CYCLES();
    ...
    f0,0();
    ...
    f0,i();
    ...
    f0,n();
    ...
    time2 = GET_CYCLES();
    latency = time2 - time1;
    record_latency_in_histogram(latency);
} 
Figure 2: The instrumentation DARC adds to f0 when DARC is started. f0,0, f0,i, and f0,n are functions that f0 calls.
DARC begins by instrumenting f0 with OSprof code, as shown in Figure 2. In our notation, the callees of f0 are f0,0 to f0,n. The ellipses represent any code present in the original program that is not relevant to our discussion. The GET_CYCLES function reads the current value of the register which contains the current number of clock ticks on the CPU (e.g., RDTSC on x86). These notations are also used for Figures 3 and 4. The instrumentation accumulates profile data, which is displayed to the user upon request. DARC examines changes between bins in the histogram to identify peaks, and displays the peak numbers to the user along with the histogram. The peak analysis takes the logarithmic values of the y-axis into account, mimicking the way a human might identify peaks. The user may then communicate the desired peak to DARC. At this point DARC translates the peak into a range of bins. If the desired peak is known ahead of time, the user may specify the peak number and the number of times f0 should be called before translating the peak into a bin range. Once f0 is called that number of times, the profile is displayed so that the user may see the profile that the results will be based on.
f0 {
    root->start = GET_CYCLES();
    ...
    f0,0();
    ...
    c = root->child[i];
    c->start = GET_CYCLES();
    f0,i();
    c->latency = GET_CYCLES() - c->start;
    if (c->latency > c->maxlatency)
        c->maxlatency = c->latency;
    ...
    f0,n();
    ...
    root->latency = GET_CYCLES() - root->start;
    if (is_in_peak_range(root->latency)) {
        process_latencies();
        num_calls++;
    }
    if (num_calls % decision_calls == 0) {
        choose_root_causes();
        num_calls = 0;
    }
    reset_latencies();
} 
Figure 3: The instrumentation DARC adds to f0 after a peak is chosen. The instrumentation for f0,0 and f0,n is similar to that of f0,i, and was elided to conserve space.
Once a peak is chosen, the original instrumentation is replaced by the instrumentation shown in Figure 3. When f0 is executed, DARC measures the latencies of f0 and its callees. The maximum latency for each function is stored in the appropriate fnode. The maximum is used because a function may be called more than once in the case of loops (this is explained further in the following paragraph). Because the latencies of the callees are measured from within f0, the latency stored in the fnode of f0,i is guaranteed to be the latency of f0,i when called by f0. The latencies are processed only if the latency of f0 lies in the range of the peak being analyzed. Otherwise, they are discarded. Note that in Figure 3, the start and latency variables in the fnode are thread-local to support multi-threaded workloads.
When DARC calls the process_latencies function (see Figure 3), it first approximates the latency of f0 itself, as latencyf0 - (Σi=0n latencyf0,i). It then looks for the largest latency contributors among f0 and the callees, whose latencies are in the same bin as the maximum latency. In the case of a function fl being called from a loop, only the maximum latency is attributed to fl, and the remainder of the latencies are attributed to fl's caller. Because of this, if individual calls to fl have high latencies, fl will be chosen as a root cause. Otherwise, it is the loop in fl's caller that is causing the high latency, so it will be chosen.
To improve accuracy, DARC does not make root cause decisions based on a single call of f0. Instead, it increments a counter, maxcount, in the fnodes of the largest latency contributors. Root cause decisions are made after a user-defined amount of times where the latency of f0 has been in the range of the peak being analyzed. The main latency contributors are those whose value of maxcount are within a user-defined percentage of the largest maxcount value. These functions are root cause functions, and their fnodes are marked as such. DARC always clears the latencies that were recorded before f0 returns.
Before describing how descendants of f0 that have been marked as root cause functions are instrumented, the concept of left shift must be introduced. As DARC descends deeper into the code, the peak being analyzed shifts to the left. To understand why this occurs, assume the peak is in bin N of f0's profile. Further, the main latency contributor for this peak is f0,i. The peak, as seen in the profile of f0, includes the latency for f0 itself, as well as the latencies for the other functions that f0 calls. However, the peak in f0,i does not contain these additional latencies, and so the peak may shift to the left in the profile of f0,i.
f0,i {
    ...
    c = parent->child[j];
    c->start = GET_CYCLES();
    f0,i,j();
    c->latency = GET_CYCLES() - c->start;
    if (c->latency > c->maxlatency)
        c->maxlatency = c->latency;
    ...
} 
Figure 4: The instrumentation DARC adds to f0,i, and f0,i,j is a function that f0,i calls.
Rather than calculating the location of the peak in f0,i, DARC keeps the decision logic in f0. Root cause functions other than f0 are instrumented as shown in Figure 4. Assume f0 calls functions f0,0 to f0,n, and f0,i is chosen as a root cause. Further, f0,i calls f0,i,0 to f0,i,m. In f0,i, latencies for each f0,i,j are calculated, but not processed. DARC does not add instrumentation to measure the latency of f0,i because it is measured in f0. DARC creates fnodes for each f0,i,j, with f0,i as the parent.
Each new root cause function (f0,i in our example) is added to a list of nodes that f0 processes before returning. Before returning, if f0's latency is within the peak, DARC traverses this list to process latencies, and possibly chooses the next round of root cause functions. To minimize the impact of the decision code on the latency of f0, f0 places the latency information on a queue to be processed off-line by a separate thread. DARC removes instrumentation that is no longer needed using a second lower-priority queue for the instrumentation removal requests. This is because removing instrumentation is a performance optimization and can be a slow operation, and so the delays on the analysis should be minimized.
When DARC determines that a function (and not any of the functions that it calls) is responsible for the specified peak, DARC stops exploring along that call-path. DARC also stops exploring a call-path if it reaches a function that does not call any functions, or after the root cause path has grown to the user-specified length. When all call-paths have completed, DARC removes all remaining instrumentation and the program continues to run as normal. DARC's status may be queried by the user at any time. This status includes the latency histogram for f0, the analysis status ("in progress," "maximum depth reached," or "root cause found"), the ftree, and the maxcount values for each fnode.

3.1  Tracking Function Nodes

figures/hashmap.png figures/hashmap2.png
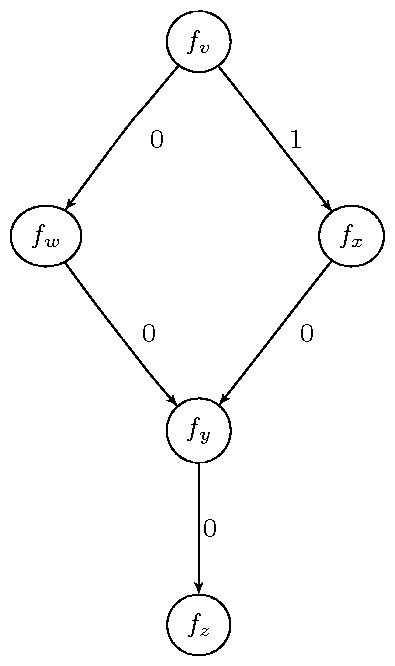
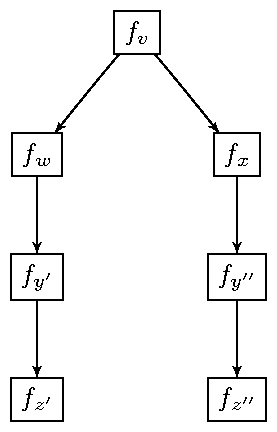
Figure 5: An example of a call-graph (left) with a possible corresponding ftree (right) that requires a hash table to avoid duplicate instrumentation. Edge labels in (a) are fnode identifiers, which are enumerations of each fnode's children. All nodes belong to root cause paths.
Before instrumenting a function, DARC must check if the function has already been instrumented to avoid duplicating instrumentation. An example of how this could occur is shown in Figure 5. Here the latency of fy is measured from fw and fx. DARC then determines that fy is a root cause of both paths. Because fy was chosen as a root cause twice, it would be instrumented twice to measure the latency of fz. We avoid this by using a hash table to track which functions have been instrumented. A hash table is used because instrumented functions cannot be tracked by marking fnodes, because there may be multiple fnodes for a single function.
When more than one fnode exists for each instrumentation point, the fnode cannot be tied to the instrumentation. For example, there are two fnodes for fy, so fy's instrumentation cannot always use the same fnode. To solve this, DARC decouples the fnode tracking from the instrumentation by using a global (thread-local) fnode pointer, current_fnode, which points to the current fnode. This pointer is always set to f0 at the start of f0. Each instrumented function sets the current_fnode pointer by moving it to a specific child of the fnode that current_fnode is pointing to. It does so using the fnode identifiers (see labels on the call-graph edges in Figure 5(a)). These fnode identifiers are simply an enumeration of the callees of the parent function. In addition, each fnode contains a thread-local saved_fnode pointer, where the value of the global pointer is saved so that it can be restored after the function call. In Figure 5, fy's instrumentation will save current_fnode, and then change it to point to the first child of the current fnode. This will cause current_fnode to point to the correct fy fnode regardless of whether it was called via fw or fx.

3.2  Filtering

DARC performs two types of filtering to ensure that only relevant latencies are measured and analyzed. First, process ID (PID) filtering ensures that only function calls that are called in the context of the target process or thread group are analyzed. This is important for functions that reside in shared libraries or the operating system. Second, it performs call-path filtering. It is possible for functions that are not part of a root cause path to call a function that DARC has instrumented. In this case, latency measurements should not be taken, because they may reduce the accuracy of the analysis. For example, lower-level functions are generally called from several call-paths, as the functions tend to be more generic. Performing this filtering can increase the accuracy of DARC's analysis by reducing noise in the captured latencies. Call-path filtering also ensures that no function that is called from outside of the root cause paths will modify the current_fnode pointer.
DARC uses an efficient call-path-filtering technique. Each fnode contains a thread-local flag to specify that it was called along a root cause path. The flag in f0's fnode is always set. Before a root cause function calls another root cause function, it sets the flag of its callee's fnode if its own flag is set. The latency measurements and analysis are only executed when the flag of the current fnode is set.
Although others [3] have used a relatively expensive and compiler-dependent stack walk to perform call-path filtering, our method is sufficient. It is simple to prove inductively that if a function is called as part of a root cause path, then the flag in its corresponding fnode is set. Further, it is simple to prove that if a function is not called as part of a root cause path, then its flag will not be set.

3.3  Profiling Basic Blocks

If the instrumentation method used to implement DARC has knowledge about basic blocks, DARC can instrument these as well. This is useful in two cases. First, when DARC reaches the end of a root cause path, DARC can then proceed to narrow down the root cause to a basic block in that function. DARC acts on basic blocks in the same way as it does on functions: it creates an fnode for each basic block, and sub-blocks are treated as callees of those blocks.
The second case where basic block instrumentation is useful is if a function calls a large number of other functions. Instrumenting all of the functions at once may add too much overhead. The user may specify a threshold for the maximum number of functions to be instrumented at once. If this threshold is about to be exceeded, DARC instruments only those function calls that are not called from a basic block nested within the function, and also instruments any basic block containing a function call. There is no need to instrument basic blocks that do not call functions because their latencies are included in the latency of the function itself. After DARC narrows down the root cause to a basic block, it instruments that block to continue its analysis.
DARC can be set to always instrument basic blocks before function calls. This reduces the overhead incurred at any given point in time. The trade-off is that because there are more steps to finding a root cause, the period of time in which overheads are incurred is prolonged. In addition, DARC consumes more memory because the ftree contains basic blocks as well as functions.

3.4  Resuming DARC

DARC can use its output as input in a future run, allowing it to continue a root cause search without repeating analysis. After parsing the previous output, DARC rebuilds the ftree (including the maxcount values), and inserts the needed instrumentation. The ability to resume analysis is important in two cases. First, a user may search for root cause paths up to a specified length and later need more information. Second, a program may not run for enough time to fully analyze it, or the user may be analyzing a specific phase of a program's execution. In this case, the program may signal DARC on when to begin and end the analysis.
If desired, a new OSprof profile for f0 can be collected before DARC resumes analysis, and this profile can be compared to the previous profile to ensure that the latency distribution has not changed. A change in the distribution may be caused by factors such as changes in the execution environment or different input to the process. DARC compares the profiles using the Earth Mover's Distance (EMD) algorithm, which is commonly used in data visualization as a goodness-of-fit test [16]. In previous work, its accuracy was shown to be better than the other algorithms [8].

3.5  Recursion

figures/recursion2.png figures/recursion.png
Figure 6: A recursive call-graph (left) with a corresponding ftree (right), where only fx has been identified as a root cause at this point. The numbers on the edges of the call-graph are the fnode identifiers.
To handle recursion, the ftree needs to have one fnode for every instance of a function call, as described in Section 3.1. Additionally, DARC needs to know when the code execution goes past a leaf in the ftree and then re-enters it by way of recursion. For example, in Figure 6, DARC must know that after fy calls a function, it is no longer in the ftree. This is because fy may call fx, which would incorrectly set current_fnode to fx. To solve this, DARC has a thread-local flag that tracks when the execution leaves the ftree. DARC ensures that the same function execution that sets the flag to false sets it back to true.

3.6  Analyzing Preemptive Behavior

Preemptive behavior refers to any case where the primary thread that is being investigated is stopped and another piece of code is set to run. This can be when the main process is preempted for another process to run or when an interrupt occurs. Preemptive behavior may concern us when the latency of a secondary code path is incorporated into the latencies that DARC measures, although in general these latencies may be ignored [8]. The original OSprof methodology used system-specific knowledge about the quantum length to determine when the process was preempted, and intuitive guesses to determine when interrupts caused peaks.
DARC measures preemptive behavior only if the added latency will be incorporated into the current latency measurements. This happens if the code being executed in the primary thread is in the subtree of an fnode that is currently being investigated. These fnodes contain extra variables to store preemption and interrupt latencies. In cases where multiple preemptive events of the same type occur, DARC stores the sum of their latencies (recall that DARC resets latency information after each execution of f0).
If the name or address of the appropriate scheduler function is available, DARC can instrument it to check if the target process was preempted, and for how long. DARC stores the total amount of time spent while preempted in the appropriate fnode, and uses this data when searching for root causes. If preemption latency was greater than the other measured latencies, then DARC reports "preemption" as the cause of the peak.
For interrupts, if the name or address of the main interrupt routine is known, DARC instruments it to record the latencies in an array contained in the proper fnode that is indexed by the interrupt number. Latencies are only recorded if the target process was executing in the subtree of a function being analyzed. In addition, DARC keeps a small auxiliary array to handle the case where an interrupt occurs while processing an interrupt. If an interrupt is determined to be a root cause, DARC reports the interrupt number and handler routine name.

3.7  Analyzing Asynchronous Paths

An asynchronous path refers to a secondary thread that acts upon some shared object. Examples of this are a thread that routinely examines a system's data cache and writes modified segments to disk, or a thread that takes I/O requests from a queue and services them. Asynchronous paths are not uncommon, and it may be desirable to analyze the behavior of these paths. Work done by asynchronous threads will generally not appear in a latency histogram, unless the target process waits for a request to be completed (forcing synchronous behavior). An example of such behavior can be seen in the Linux kernel, where a request to read data is placed on a queue, and a separate thread processes the request. Because the data must be returned to the application, the main thread waits for the request's completion.
To analyze asynchronous paths, the user may choose a function on the asynchronous path to be f0. This requires no extra information, other than the name or address of f0. However, if it is desirable to analyze an asynchronous path in the context of a main path, DARC requires extra information. For cases with a request queue, DARC needs to know the address of the request structure. DARC adds call-path filtering along the main path up to the point where the request structure is available to DARC. At this point, DARC adds the request structure's address to a hash table if the PID and call-path filtering checks all pass. When the secondary thread uses the request object, DARC checks the hash table for the object's address. If it is there, DARC knows that the target process enqueued the object along the call-path that is of interest to the user.
In the case where the asynchronous thread is scanning all objects (with no request queue), the object can be added to the hash table when appropriate. This technique requires the same extra knowledge as the situation with a request queue: the call-path to filter and the name of the request object. In the case where this information is not available, DARC proceeds without PID or call-path filtering.

4  Implementation

DARC operates by using dynamic binary instrumentation (DBI) to find the root causes of a peak. An alternative to DBI would be a compile-time method, where all of the instrumentation is added to the source code. A compile-time method has the benefits of lower overheads to activate instrumentation and the ability to report the names of inline functions. However, there are five main drawbacks to compile-time methods. First, the build system would need to be changed to add the code. In large projects, this may be a daunting task. Second, the application would need to be stopped to run the version with the new instrumentation. This is a problem for critical or long-running applications. Third, because all instrumentation must be inserted ahead of time, there would be a large increase in code size, and all code paths would incur overheads when skipping over the instrumentation. Fourth, all source code needs to be available. Although application code is usually available to developers, libraries and kernel code may not be. Finally, indirect calls can only be resolved at runtime.
DARC includes a script that takes a configuration file as input, translates the program name into a PID and function names into code addresses, and executes DARC with the appropriate parameters. This makes DARC easier to operate, because the user does not need to look up these values manually. Internally, DARC does not use any function names, so its output contains only function addresses. DARC includes a user-level program that interacts with the kernel component using an ioctl, and allows a user to send commands to the DARC module to display the ftree, display f0's latency histogram, and to set the initial root cause path when resuming DARC. DARC also includes a user-level script to process the output, translating addresses to function names and interrupt numbers to interrupt names.
The current DARC prototype is implemented as a kernel module for the Linux 2.6.23 kernel. It uses kprobes for DBI [5]. Simply put, a kprobe consists of a function and the address where the function is to be inserted. Most DARC instrumentation is inserted using ordinary kprobes. However, the instrumentation that is executed before f0 returns (see end of Figure 2) is inserted using a kretprobe, or "return kprobe." This type of kprobe is executed before a function returns from any point. To handle function pointers, DARC adds an additional kprobe to the call site that checks the appropriate register for the target address.
We used kprobes for two reasons. First, it is part of the mainline Linux kernel. Code inside the mainline kernel tends to be stable and well-maintained, and is available in any recent kernel version. Kprobes are currently available for the i386, x86_64, ppc64, ia64, and sparc64 architectures, and it can be expected that other architectures that Linux supports will be supported by kprobes in the future. The second reason is that kprobes provide a minimalistic interface-they place a given section of code at a given code address. This shows that DARC can be implemented using any DBI mechanism, and can be ported to other operating systems and architectures.
DARC also uses a disassembler that we modified from the Hacker Disassembler Engine v0.8 [15]. We converted the NASM syntax to GNU assembler syntax using intel2gas [14], and converted the opcode table from NASM to C. We chose this disassembler because it is very small and lightweight (298 lines of assembly in our version). We also added a C function that returns the callsites of a given function, which took 84 lines of code. This function also handles tail-call optimizations (if a function x calls a function y immediately before returning, the call and return can be replaced by a jump to y, and y then returns to x's return address). This provides the minimum necessary functionality for DARC except for the identification of basic blocks, which our current prototype does not yet support.
DARC uses kprobes in a non-standard way. An initial version inserted two kprobes per function call: one before the call and one after. This may cause problems if the code path jumps to the second kprobe without executing the first one. We had to insert an extra check to ensure that the code in the second kprobe was executed only if the first kprobe was called. Instead, the first kprobe saves the return address of the function f that is being called. The kprobe then modifies f's return address on the stack to point to a new function that essentially contains the code of the second kprobe. This new function then returns to f's original call point. This has two benefits. First, it guarantees that the code contained in the second kprobe is executed only when the first is. Second, DARC now uses only one kprobe per function call, which speeds up the code because each kprobe causes a trap to occur.
Although the current DARC prototype is implemented in the kernel, the design is portable enough to use in user-space as well. Additionally, the design is flexible enough that DARC could begin investigating peaks in a user process and continue the analysis in the kernel if necessary [12]. The implementation would instrument the user-space application and invoke the kernel instrumentation when it detects system calls. This can be done by creating separate user-space and kernel implementations, and synchronizing latency measurements. Alternatively, probes can be added to the user-space application from the kernel, so that DARC's instrumentation code, data structures, and decision logic reside only in the kernel. This avoids the need to duplicate code and synchronize latency information, and allows for simple call-path filtering across the user-kernel boundary.

5  Limitations

DARC has three main limitations. First, DARC assumes that the latency distribution of f0 is fairly static. If the behavior of the code being analyzed changes during analysis, DARC may not be able to conclude the analysis. However, we expect this to be rare. Second, inline functions and macros cannot be analyzed separately because this DARC implementation uses binary instrumentation. Third, if the source of the code being analyzed is not available, the binary should include symbols so that the output can be translated from function addresses to names. The function names should also be descriptive enough for the user to guess what the function does. Otherwise, the user must disassemble the binary to understand the root cause.

6  Setting DARC Parameters

DARC has several parameters that affect its execution. These include the program name or PID for filtering and the function to analyze. To limit DARC's runtime, the user may set the maximum search depth. As described in Section 3.4, DARC may be resumed if this parameter is not set high enough. The decision_ops parameter sets the number of times f0 is called where its latency is within the desired range until a root cause decision is made. This parameter allows the user to trade off analysis runtime for accuracy. The maxcount_percentage parameter is used to determine the maxcount threshold for functions to choose the next level of root causes. Acceptable values range from 0 to 1, and the threshold is maxcount_percentage * maximum_maxcount. A value of 1 will cause one function to be chosen as a root cause for the current decision unless more than one function has a maxcount value equal to the maximum. Lower values will allow for more functions to be chosen potentially as root causes. We have two more parameters useful for benchmarking, start_ops and start_peak, but they are not meant for normal use. The start_ops parameter is the number of elements to collect in the OSprof histogram before choosing a peak specified by start_peak.

7  Experimental Setup

We now describe the experimental setup used for our use cases (Section 8) and our performance evaluation (Section 9). The test machine was a Dell PowerEdge SC 1425 with a 2.8GHz Intel Xeon processor, 2MB L2 cache, and 2GB of RAM. The machines were equipped with two 73GB Seagate Cheetah ST373207LW SCSI disks. We used one disk as the system disk, and the additional disk for the test data. The machines ran Fedora Core 6 updated as of October 8, 2007, with kernel version 2.6.23. The file system for all benchmarks in Section 9 was ext2, unless otherwise specified. To aid in reproducing these experiments, the DARC and workload source code, a list of installed package versions, the kernel configuration, and a full hardware description are available at www.fsl.cs.sunysb.edu/docs/darc/.

8  Use Cases

In this section we describe some interesting examples that illustrate DARC's ability to analyze root causes. To highlight the benefits of using DARC, we show three usage examples that were first published in the OSprof paper [8]. We compare the use of DARC to the manual analysis described in the OSprof paper. We show that DARC does not require as much expertise from the user, is faster, and gives more definitive results.
The use cases that we present highlight three of DARC's interesting aspects: analyzing interrupts, investigating asynchronous paths, and finding intermittent lock contentions. We recreated all of the test cases on our test machine. The first example used a workload that reads zero bytes of data in a loop. The remaining two examples used a grep workload, where the grep utility searched recursively through the Linux 2.6.23 kernel source tree for a nonexistent string, thereby reading all of the files. We will specify the values of the start_ops and decision_ops parameters (described in Section 6) for each use case.

8.1  Analyzing Interrupts

data/interrupts.png
Figure 7: A profile of the read operation that reads zero bytes of data.
Figure 7 shows a profile of the read operation issued by two processes that were repeatedly reading zero bytes of data from a file. This profile contains three peaks, and we order them from left to right: first (bins 7-9), second (10-13), and third (14-18). The first peak is clearly the usual case when the read operation returns immediately because the request was for zero bytes of data. For this peak, DARC reports a root cause path showing the read path up to the point where the size of the read is checked to be zero. At this point, the functions return because there is no work to be done. The root cause path as shown by DARC is:
vfs_read do_sync_read generic_file_aio_read.
Note that the last two functions here are indirect calls, but DARC displays name of the target function. This output tells us that the read operation is responsible for the peak.
In the OSprof paper, the authors hypothesized that the second peak was caused by the timer interrupt. They based this on the total runtime of the workload, the number of elements in the peak, and the timer interrupt frequency. Recall from Section 3.6 that DARC instruments the main interrupt handling routine (do_IRQ in our case). This instrumentation checks if the target process was executing a function that DARC is currently analyzing. If so, it records the latencies for each interrupt type and attributes these measurements to the executing function. In our case, we set f0 to vfs_read, as before. DARC reported "interrupt 0" as the root cause, which our post-processing script translated as "timer interrupt." DARC arrived at this conclusion because after comparing the latencies of vfs_read, its callees, and the latencies for each interrupt number, interrupt 0 always had the highest latency.
Although it was possible to determine the cause of the peak without DARC, doing so would have required deep insight and thorough analysis. Even so, the cause of the peak could not be confirmed with manual analysis. DARC confirmed the cause, while requiring much less expertise from the user. Additionally, DARC discovered that the third peak was caused by interrupt 14 (the disk interrupt), which was not reported in the OSprof paper. DARC analyzed this third peak in the same way as it did with the second.
For analyzing this profile, we set start_ops to 100 and decision_ops to 20. From our experience, we found these values to be generally sufficient.

8.2  Analyzing Asynchronous Paths

data/ext2-readdir.png
Figure 8: A profile of the ext2 readdir operations captured for a single run of grep -r on a Linux 2.6.23 kernel source tree.
Running the grep workload on ext2 resulted in the profile shown in Figure 8. There are four peaks in the profile of the readdir operation, ordered from left to right: first (bin 9), second (11-14), third (16-17), and fourth (18-23). In the OSprof paper, prior knowledge was used as a clue to the cause of the first peak. The OSprof authors noted that the latency is similar to the latency of reading zero bytes (see the first peak in Figure 7). This implies that the operation completes almost immediately. The OSprof authors guessed that the cause of the peak is reading past the end of the directory. They confirmed this by modifying the OSprof code to correlate the latency of the first peak with the condition that the readdir request is for a position past the end of the directory. We ran DARC to analyze this first peak, and the resulting root cause path consisted of a single function: ext2_readdir. This is because the function immediately checks for reading past the end of the directory and returns.
The causes of the remaining peaks were analyzed in the OSprof paper by examining the profile for the function that reads data from the disk. The OSprof authors noted that the number of disk read operations corresponded to the number of operations in the third and fourth peaks. This indicates that the operations in the second peak are probably cached requests, and the operations in the third and fourth peaks are satisfied directly from disk. Further, based on the shape of the third peak, they guessed that the operations in that peak were satisfied from the disk's cache. Based on the knowledge of the disk's latency specifications, they further guessed that the operations in the fourth peak were affected by disk-head seeks and rotational delay.
When DARC analyzed the second peak, it displayed the following root cause path, which clearly indicates that the root cause is reading cached data:
ext2_readdir ext2_get_page read_cache_page read_cache_page_async __read_cache_page.
For the third peak, DARC produced the following root cause path:
ext2_readdir ext2_get_page read_cache_page read_cache_page_async ext2_readpage mpage_readpage mpage_bio_submit bio_submit.
Notice that first portion of the root cause path is the same as for the second peak. However, after calling the __read_cache_page function to read data from the cache, it calls ext2_readpage, which reads data from disk. Eventually the request is placed on the I/O queue, with the bio_submit function (bio is short for block I/O). For all of the use cases, DARC was tracking asynchronous disk requests, as described in Section 3.7. If a request reaches the bio_submit function and is not filtered by PID or call-path filtering, DARC records the address for the current block I/O structure in a hash table. After DARC analyzed this peak for the first time, we restarted DARC, giving it the previous call-path output as input. We set f0 to the function that dequeues the requests was the queue. This allowed us to analyze the asynchronous portion of the root cause path while retaining the PID and call-path filtering from the main path. DARC then produced the following output:
__make_request __elv_add_request elv_insert cfq_insert_request blk_start_queueing scsi_request_fn.
In this root cause path, __make_request removes the request from the queue. The cfq_insert_request function is a function pointer that is specific to the I/O scheduler that the kernel is configured to use (CFQ in this case). Finally, scsi_request_fn is a SCSI-specific function that delivers the request to the low-level driver. The root cause path for the fourth peak was identical to that of the third, indicating that disk reads are responsible for both peaks, as reported by OSprof. Unfortunately, because requests from both peaks are satisfied by the disk, the factor that differentiates the two peaks is hardware, and therefore software techniques cannot directly find the cause. In this case, one must use manual analysis to infer the causes.

8.3  Analyzing Intermittent Behavior

data/reiser3tail_map.png
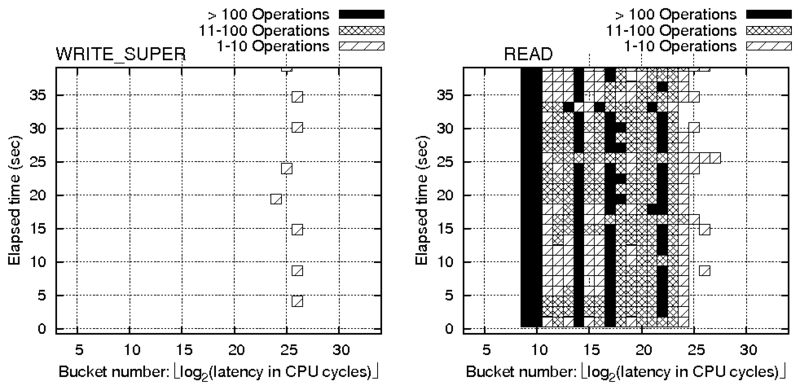
Figure 9: Reiserfs 3.6 file-system profiles sampled at 1.5 second intervals.
On Reiserfs, the grep workload resulted in the profiles shown in Figure 9. These are time-lapse profiles. Because OSprof profiles are small, OSprof can store latency measurements in different histograms over time to show how the distributions change. The x-axis represents the bin number, as before. The y-axis is the elapsed time of the benchmark in seconds, and the height of each bin is represented using different patterns. The profile on the left is for the write_super operation, which writes the file system's superblock structure to disk. This structure contains information pertaining to the entire file system, and is written to disk by a buffer flushing daemon every five seconds by default. The profile on the right is for the read operation.
The bins on the right side of the read profile correspond to the bins in the write_super profile. This indicates that there is some resource contention between the two operations, but the OSprof analysis methods cannot confirm this, nor can they give more information about the resource in question. The OSprof authors attributed this behavior to a known lock contention. A user that was not informed about this lock contention would struggle to analyze this behavior manually. First, the user may be confused as to why the file system is writing metadata during a read-only workload. The user must know that reading a file changes the time it was last accessed, or atime. Further, the atime updates are written by the buffer flushing daemon, which wakes periodically. This would lead the user to collect a time-lapse profile for this case. In the end, only source code investigation would provide an answer.
Using DARC, we analyzed both profiles shown in Figure 9. We first ran DARC on the read path. We set start_ops to 5,000 so that enough delayed read operations would be executed, and we set decision_ops to 5, because the read operations do not get delayed very often. The root cause path that DARC displayed was:
vfs_read do_sync_read generic_file_aio_read do_generic_mapping_read touch_atime __mark_inode_dirty reiserfs_dirty_inode lock_kernel.
We can see from this that the read operation (vfs_read) caused the atime to be updated (touch_atime). This caused the lock_kernel function to be called. This function takes the global kernel lock, also known as the big kernel lock (BKL). To understand why this happens, we can look at the siblings of the lock_kernel fnode (not shown above because they are not root causes): journal_begin, journal_end, and unlock_kernel. This tells us clearly that Reiserfs takes the BKL when it writes the atime information to the journal.
For the write_super operation, we turned off PID filtering because the superblock is not written on behalf of a process. We set both start_ops and decision_ops to 5, because the write_super operation does not get called frequently. DARC produced the following root cause path:
reiserfs_write_super reiserfs_sync_fs lock_kernel.
Again, the siblings of the lock_kernel fnode are journal-related functions. We now know that the lock contention is due to Reiserfs taking the BKL when writing atime and superblock information to the journal.

9  Performance Evaluation

We used the Autopilot v.2.0 [20] benchmarking suite to automate the benchmarking procedure. We configured Autopilot to run all tests at least ten times, and computed the 95% confidence intervals for the mean elapsed, system, and user times using the Student-t distribution. In each case, the half-width of the interval was less than 2% of the mean. We report the mean of each set of runs. To minimize the influence of consecutive runs on each other, all tests were run with cold caches. We cleared the caches by re-mounting the file systems between runs. In addition, the page, inode, and dentry caches were cleaned between runs on all machines using the Linux kernel's drop_caches mechanism. This clears the in-memory file data, per-file structures, and per-directory structures, respectively. The sync function was called first to write out dirty objects, as dirty objects are not free-able.
We had two main requirements for choosing a benchmark. First, it should run for a long enough time to obtain stable results-we ensured that all tests ran for at least ten minutes. Second, the benchmark should call one function repeatedly. This function will be the one DARC analyzes, so the DARC instrumentation will be constantly executed. We ran two benchmarks. The first repeatedly executes the stat system call on a single file, which returns cached information about the file. This shows DARC's overhead when investigating a relatively low-latency, memory-bound operation. The second benchmark reads a 1GB file in 1MB chunks 50 times using direct I/O (this causes data to be read from disk, rather than the cache). This shows the overheads when investigating a higher-latency, I/O-bound operation.
Recall the two parameters that affect DARC's overhead that we described in Section 8: start_ops and decision_ops. For our benchmarks, we chose these values such that the analysis does not finish by the time the benchmark concludes, forcing DARC to run for the entire duration of the benchmark. We present the values of these parameters for each benchmark, which are orders of magnitude higher than the values used in the use cases presented in Section 8.
Stat workload  
We ran the stat workload with 300 million operations, resulting in an elapsed time of approximately 689 seconds without DARC. We then used DARC to analyze the stat call, and saw that there was one peak, with a single root cause path that is five levels deep (shown later). The number of fnodes in each level of the ftree, from top to bottom, were 1, 3, 3, 11, 1, and 6. Because we wanted DARC to reach the maximum depth without finishing its analysis, we set start_ops to 1,000 operations and decision_ops to 60,000,000 operations.
data/bench-stat.png
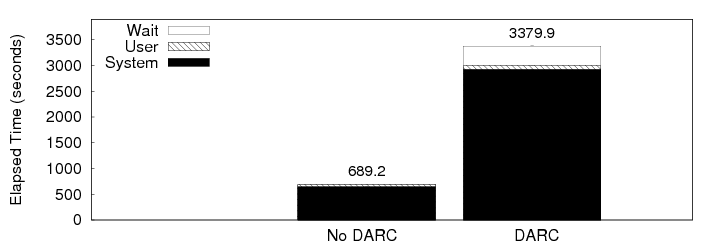
Figure 10: Results for the stat benchmark. Note that error bars are always drawn, but may be difficult to see.
data/bench-stat-line.png
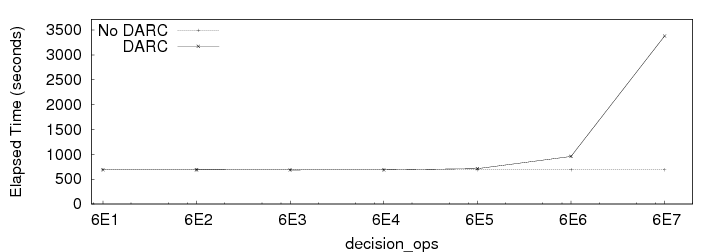
Figure 11: The overheads for running DARC with the stat benchmark using different values for the decision_ops variable. Results without running DARC are shown as a baseline. Note that the x-axis is logarithmic.
The runtime with the DARC analysis took approximately 3,380 seconds, or about 4.9 times longer. This is because the stat operation returns very quickly (the average latency is 2.3 microseconds), and the DARC instrumentation adds approximately 8.9 microseconds per operation. The results are summarized in Figure 10. We refer to the portion of time that is not counted as user or system time as wait time (seen as the white portion of the bars). This is the time that the process was not using the CPU. In this case, the wait time overhead is mostly due to the kprobes, which do not run in the context of the process. The system time overhead is mostly due to the helper threads (which run in the process context), and the DARC function that measures the latency after a function call (recall from Section 4 that this instrumentation was moved from a kprobe to a regular function using return address modification).
It is important to note that these figures depict an extreme worst-case scenario. Under realistic conditions, such as in the use cases presented in Section 8, decision_ops was on the order of tens of operations, whereas here it was on the order of tens of millions of operations. DARC is designed to analyze longer-running applications, and the time spent performing the analysis is negligible compared to the application's total run time.
To show how the decision_ops variable affects overheads, we ran the benchmark with different values for decision_ops, and kept start_ops at 1,000 operations. The results are shown in Figure 11. The results for DARC with values of up to 60,000 and the results when not running DARC at all were statistically indistinguishable. In addition, we calculated that DARC analyzed latencies for less than one second for these values. When we set decision_ops to 6 * 105, 6 * 106, and 6 * 107, the overheads were 3.2%, 28.8%, and 4.9 times, respectively. For these same values, DARC performed its analysis for approximately 1.2%, 12%, and 100% of the total runtime. This shows how the overheads increase as DARC's analysis was prolonged.
DARC reported the same root cause path for all cases:
vfs_stat_fd __user_walk_fd do_path_lookup path_walk link_path_walk.
This shows that DARC has negligible overheads for real-world configurations, where the analysis can complete in less than one second.
Random read workload  
data/bench-randread.png
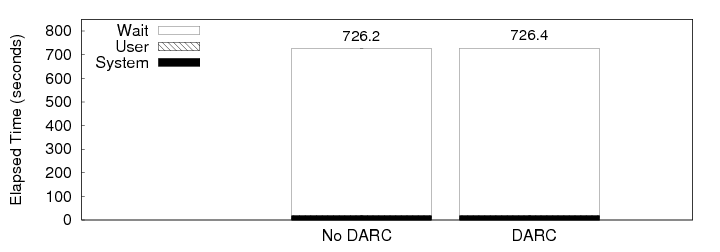
Figure 12: Results for the random read benchmark. Note that error bars are always drawn, but may be difficult to see.
For the random read benchmark, we set the start function to the top-level read function in the kernel. There was only a single peak in the profile, and DARC informed us that there was one root cause path consisting of eight functions. Because the benchmark executes 51,200 operations, we set start_ops to 1,000 operations, and decision_ops to 6,500. This allowed DARC to reach the final root cause function without completing the analysis. The root cause path for this benchmark was:
vfs_read do_sync_read generic_file_aio_read generic_file_direct_IO ext2_direct_IO __blockdev_direct_IO io_schedule.
The ftree for this benchmark was rather large, with the levels of the ftree having 1, 7, 3, 4, 5, 1, 39, 3, and 28 fnodes, from top to bottom. The results are shown in Figure 12. Running the benchmark with and without DARC produced statistically indistinguishable runtimes, with the elapsed times for both configurations averaging approximately 726 seconds. This is because the overheads of the DARC instrumentation are small compared to the time required to read data from the disk. The average read operation latency was approximately 14 milliseconds, and we saw from the stat benchmark that DARC added approximately 9 microseconds to each operation.

10  Related Work

Previous work in this area has focused on using call-paths as a unit for metric collection and using dynamic instrumentation to investigate bottlenecks. We discuss each of these topics in turn.
Call-path profiling  
Others have explored using call-paths as a main abstraction for performance profiling. These projects have also utilized dynamic binary instrumentation for their profiling. PP [2] implements an algorithm for path profiling, which counts the execution frequencies of all intra-procedural acyclic paths by encoding the paths as integers. This work was extended to use hardware metrics rather than relying on execution frequencies and to use a calling context tree (CCT) to store metrics [1]. The CCT is similar to our ftree, but has a bounded size because it does not contain multiple entries for loops, and it does not differentiate between a function calling another function multiple times. Our ftree can afford to contain these extra nodes because it contains few paths, rather than an entire call-tree, and is also bounded by the user-specified maximum depth. PP was also extended to handle inter-procedural paths [9,10].
The TAU parallel performance system [17] has various profiling, tracing, and visualization functionality to analyze the behavior of parallel programs. One mode of operation which is similar to DARC is call-path profiling. Here, TAU generates its own call stack by instrumenting all function calls and returns. This method handles both indirect and recursive calls. This stack is used to provide profiling data that is specific to the current call-path. A quantitative comparison could not be made because the current implementation of DARC runs in the kernel whereas TAU runs in user-space. An extension to TAU, called KTAU [13], was created to supplement TAU with latency information from the kernel. However, KTAU only collects simple latency measurements from pre-defined locations in the kernel and uses source instrumentation, so a meaningful quantitative comparison could not be made here either.
CATCH associates hardware metrics with call-path information for MPI and OpenMP applications [6]. It builds a static call-graph for the target application before it is executed. CATCH uses a method similar to that of DARC to keep track of the current node that is executing, but uses loops in its tree for recursive programs. It is also possible for users to select subtrees of the call-graph to profile rather than tracking the entire execution of the program. CATCH cannot cope with applications that use a function name for more than one function, and cannot profile applications that use indirect calls.
A major difference between these projects and DARC is that DARC performs call-path filtering, rather than call-path profiling. This means that DARC instruments only the portion of the code that is currently being investigated, rather than the entire code-base. Additionally, it generally runs for a shorter period of time. However, DARC also collects less information than profiling tools.
Another project, iPath, provides call-path profiling by instrumenting only the functions that are of interest to the user [3]. Whereas DARC searches for the causes of behavior seen in higher-level functions, iPath analyzes lower-level functions and distinguishes latencies based on the call-paths used to reach them. It does so by walking the stack to determine the current call-path, sampling the desired performance metric, and then updating the profile for that call-path with the performance data. This provides two main benefits. First, overheads are incurred only for functions that the user is profiling. Second, iPath walks the stack, so it does not need any special handling for indirect or recursive calls. The main problem with performing stack walks is that they are architecture and compiler-dependent. There are some compiler optimizations that iPath cannot cope with, and it would be difficult to port iPath to use other compilers and optimizations. In contrast, DARC's method relies more on simple and portable dynamic binary instrumentation techniques.
Combining call-path profiling with sampling, csprof samples the running program's stack periodically, and attributes a metric to the call-path [7]. It also introduces a technique to limit the depth of the stack walk when part of that stack has been seen before. However, although the stack walk is more efficient than that of iPath, csprof is also tied to the code of a specific compiler and its optimizations.
Dynamic bottleneck investigation   Kperfmon [19] is a tool that uses the Kerninst [18] dynamic instrumentation framework. For a given function or basic block, Kperfmon can collect a metric, such as elapsed time, processor time, or instruction cache misses. A user may search for a root cause by examining the results and running Kperfmon again to measure a new section of code.
CrossWalk [12] combines user-level and kernel-level dynamic instrumentation to find CPU bottlenecks. Starting at a program's main function, CrossWalk performs a breadth-first search on the call-graph for functions whose latency is greater than a pre-defined value. If the search enters the kernel via a system call, the search will continue in the kernel. It is not clear if CrossWalk can handle multiple paths in the call-graph. CrossWalk does not handle multi-threaded programs, asynchronous kernel activities, or recursion. It does not perform call-path or PID filtering.
Paradyn [11] uses dynamic instrumentation to find bottlenecks in parallel programs. It does this using a pre-defined decision tree of bottlenecks that may exist in programs. Paradyn inserts code to run experiments at runtime to determine the type of bottleneck and where it is (synchronization object, CPU, code, etc.). Instances when continuously measured values exceed a fixed threshold are defined as bottlenecks. Paradyn can narrow down bottlenecks to user-defined phases in the program's execution. Paradyn's original code-search strategy was replaced by an approach based on call-graphs [4].
One difference between the two code search strategies in Paradyn is that the original used exclusive latencies and the new strategy used inclusive latencies, because they are faster and simpler to calculate. To calculate the exclusive latency of a function, Paradyn stopped and started the timer so that the latencies of the function's callees would not be included. DARC can use exclusive latencies because the latencies of the callees are already being calculated, so it does not add much overhead. Paradyn's search strategy was also changed. Originally, Paradyn first attempted to isolate a bottleneck to particular modules, and then to particular functions in those modules. They did this by choosing random modules and functions to instrument [4]. This was replaced by a method that began at the start of the executable, and continued to search deeper in the call-graph as long as the bottleneck was still apparent.
DARC is both more flexible and more accurate than these solutions. It has the ability to search for the causes of any peak in an OSprof profile, rather than checking only for pre-defined bottlenecks. Additionally, these methods would not be suitable for finding the causes of intermittent behavior. DARC also introduces several new features, such as call-path filtering, distinguishing recursive calls, resuming searches, and investigating asynchronous events.

11  Conclusions

We designed DARC, a new performance-analysis method that allows a user to easily find the causes of a given high-level behavior that is seen in an OSprof profile. DARC allows the user to analyze a large class of programs, including those containing recursive and indirect calls. Short-lived programs and programs with distinct phases can be easily analyzed using DARC's resume feature. Access to more source code information allows the user to use DARC to analyze preemptive behavior and asynchronous paths. The ability to identify basic blocks allows DARC to narrow down root causes to basic blocks and minimize perturbations caused by instrumentation. DARC minimizes false positives through the use of PID and call-path filtering.
In our Linux kernel implementation, the overheads when analyzing high-latency operations, such as disk reads, were statistically insignificant. For faster operations, such as retrieving in-memory file information, the runtime with DARC can increase by up to 4.9 times. However, these overheads are imposed only for the time that DARC is analyzing the code. DARC is designed for analyzing long-running applications, and the period of time that this overhead is incurred is negligible compared to the overall runtime. In the benchmark exercising the fast operation, DARC required less than one second to perform its analysis. This was also seen in all of the use cases that we presented. In addition, DARC's overheads did not affect the analysis in any case.
We have shown how DARC can be used to analyze behaviors that were previously more difficult to explain. These cases include preemptive behavior, asynchronous paths, and intermittent behavior. Whereas OSprof was generally used to provide good guesses about the causes of these behaviors, DARC provided more direct evidence.
Future work  
We plan to extend the DARC implementation to allow for the analysis of user-level programs, as described in Section 4. We also plan to explore how DARC behaves in virtual machine environments, and possibly modify it to better suit those environments. Further, we plan to explore using DARC to analyze remote procedure calls, where root cause paths may reside on more than one machine.

Acknowledgments

We thank the anonymous program committee members and our shepherd Arif Merchant for their valuable comments. We also thank Nikolai Joukov for his input on the design. The idea for this work and an initial design were inspired while on internship at IBM Haifa Research Labs. This work was partially made possible thanks to an NSF HECURA award CCF-0621463, an NSF CSR-AES award CNS-0509230, and an IBM Ph.D. fellowship.

References

[1]
G. Ammons, T. Ball, and J. R. Larus. Exploiting hardware performance counters with flow and context sensitive profiling. In Proc. of the ACM SIGPLAN 1997 Conference on Programming Language Design and Implementation, pp. 85-96, Las Vegas, NV, June 1997. ACM Press.
[2]
T. Ball and J. R. Larus. Efficient path profiling. In Proc. of the 29th Annual ACM/IEEE International Symposium on Microarchitecture, pp. 46-57, Paris, France, December 1996. IEEE.
[3]
A. R. Bernat and B. P. Miller. Incremental call-path profiling. Concurrency and Computation: Practice and Experience, 19(11):1533-1547, 2007.
[4]
H. W. Cain, B. P. Miller, and B. J. N. Wylie. A callgraph-based search strategy for automated performance diagnosis. In Proc. of the 6th International Euro-Par Conference, pp. 108-122, Munich, Germany, August-September 2000. Springer.
[5]
W. Cohen. Gaining insight into the Linux kernel with Kprobes. RedHat Magazine, March 2005.
[6]
L. DeRose and F. Wolf. CATCH - a call-graph based automatic tool for capture of hardware performance metrics for MPI and OpenMP applications. In Proc. of the 8th International Euro-Par Conference on Parallel Processing, pp. 167-176, Paderborn, Germany, August 2002. Springer-Verlag.
[7]
N. Froyd, J. Mellor-Crummey, and R. Fowler. Low-overhead call path profiling of unmodified, optimized code. In Proc. of the 19th Annual International Conference on Supercomputing, pp. 81-90, Cambridge, MA, June 2005.
[8]
N. Joukov, A. Traeger, R. Iyer, C. P. Wright, and E. Zadok. Operating system profiling via latency analysis. In Proc. of the 7th Symposium on Operating Systems Design and Implementation, pp. 89-102, Seattle, WA, November 2006. ACM SIGOPS.
[9]
J. R. Larus. Whole program paths. In Proc. of the ACM SIGPLAN 1999 Conference on Programming Language Design and Implementation, pp. 259-269, Atlanta, GA, May 1999. ACM Press.
[10]
D. Melski and T. Reps. Interprocedural path profiling. In Proc. of the 8th International Conference on Compiler Construction, pp. 47-62, Amsterdam, The Netherlands, March 1999. Springer.
[11]
B. P. Miller, M. D. Callaghan, J. M. Cargille, J. K. Hollingsworth, R. B. Irvin, K. L. Karavanic, K. Kunchithapadam, and T. Newhall. The paradyn parallel performance measurement tool. IEEE Computer, 28(11):37-46, November 1995.
[12]
A. V. Mirgorodskiy and B. P. Miller. CrossWalk: A tool for performance profiling across the user-kernel boundary. In Proc. of PARCO 2003, pp. 745-752, Dresden, Germany, September 2003. Elsevier.
[13]
A. Nataraj, A. Malony, S. Shende, and A. Morris. Kernel-level measurement for integrated parallel performance views: the ktau project. In Proc. of the 2006 IEEE Conference on Cluster Computing, Barcelona, Spain, September 2006
[14]
C. Nentwich and M. Tiihonen. Intel2gas. http://www.niksula.hut.fi/~mtiihone/intel2gas/, 2000.
[15]
V. Patkov. Hacker disassembler engine. http://vx.netlux.org/vx.php?id=eh04, 2007.
[16]
Y. Rubner, C. Tomasi, and L. J. Guibas. A Metric for Distributions with Applications to Image Databases. In Proc. of the 6th International Conference on Computer Vision, pp. 59-66, Bombay, India, January 1998.
[17]
S. S. Shende and A. D. Malony. The TAU parallel performance system. International Journal of High Performance Computing Applications, 20(2):287-311, 2006.
[18]
A. Tamches. Fine-Grained Dynamic Instrumentation of Commodity Operating System Kernels. PhD thesis, University of Wisconsin-Madison, 2001.
[19]
A. Tamches and B. P. Miller. Using dynamic kernel instrumentation for kernel and application tuning. The International Journal of High Performance Computing Applications, 13(3):263-276, Fall 1999.
[20]
C. P. Wright, N. Joukov, D. Kulkarni, Y. Miretskiy, and E. Zadok. Auto-pilot: A platform for system software benchmarking. In Proc. of the Annual USENIX Technical Conference, FREENIX Track, pp. 175-187, Anaheim, CA, April 2005.

Footnotes:

1Appears in the Proceedings of the 2008 ACM International Conference on Measurement and Modeling of Computer Systems (SIGMETRICS 2008)


File translated from TEX by TTH, version 3.76.
On 25 Apr 2008, 13:21.