Auto-pilot: A Platform for System Software Benchmarking
Charles P. Wright, Nikolai Joukov, Devaki Kulkarni, Yevgeniy
Miretskiy, and Erez Zadok
Stony Brook University
1
Abstract
When developing software, it is essential to evaluate its performance
and stability, making benchmarking an essential and significant
part of the software development cycle.
Benchmarking is also used to show that a system is useful or provide
insight into how systems behave.
However, benchmarking is a tedious task that few enjoy, but every
programmer or systems researcher must do.
Developers need an easy-to-use system for collecting and analyzing
benchmark results.
We introduce Auto-pilot, a tool for producing accurate and
informative benchmark results.
Auto-pilot provides an infrastructure for running tests, sample test
scripts, and analysis tools. Auto-pilot is not just another metric or
benchmark: it is a system for automating the repetitive tasks of
running, measuring, and analyzing the results of arbitrary programs.
Auto-pilot can run a given test until results stabilize, automatically
highlight outlying results, and automatically detect memory leaks.
We have used Auto-pilot for over three years on eighteen distinct
projects and have found it to be an invaluable tool that saved us
significant effort.
1 Introduction
Benchmarking contributes evidence to the value of work, lends insight
into the behavior of systems, and provides a mechanism for
stress-testing software. However, benchmarking can be an arduous
task. Benchmarking takes a lot of time, and the initial iteration of
benchmarks often exposes bugs or inefficient code. After changes are
made to the code, the benchmarks need to be repeated, time and time
again. Once the code is bug free and stable, there are sometimes
unexpected results. The output then needs to be examined to determine
a cause. If no cause for the suspicious results is found, then the
benchmarks need to be repeated without changing any parameters to
verify the unexpected results. After the results are verified, one
variable needs to be changed at a time to narrow down the source of
the erroneous data. This cycle of benchmarking and analysis is often
repeated many times.
We have identified two primary considerations when collecting and
analyzing benchmark results:
- Accuracy The numbers that benchmarks produce need to be
mathematically correct, but an even more difficult requirement to satisfy
is that they need to be reproducible, stable, and fair.
They should be reproducible so that you can re-run the test and get
similar results. This way if you need to make slight modifications,
it is possible to go back and compare results. To help achieve this,
Auto-pilot records pertinent system information (e.g., the OS version,
hard disk model, and partitions) so that you can reproduce the test
environment as closely as possible.
Tests also need to be reproducible so that others can verify your
results.
For example, each test should be run under similar circumstances
(e.g., a cold or warm cache). If one test fails, then it may impact
all future tests, so a series of tests should be stopped so that
erroneous results are not included.
- Presentation The accuracy of results is inconsequential
if the results can not be understood and correctly interpreted. Each
benchmark usually results in hundreds or thousands of numbers. For
example, each execution of a program results in elapsed, user, and
system time. Additionally, the CPU utilization and wait (I/O) time
are reported. If there is a four-threaded benchmark that is run
twenty times, then 400 values are produced. There are also usually
many configurations of a benchmark. Each variable that is introduced
multiplicatively increases this value. In this example, if we ran the
test for 1, 2, 4, 8, 16 and 32 threads, there would be a total of
6,300 values. For every additional quantity that is measured, another
1,260 numbers are generated. Without assistance it is rather tedious
to wade through this sea of numbers.
Auto-pilot is an infrastructure that produces accurate
and informative results. Auto-pilot is not a metric or a specific
benchmark, but rather a framework to run benchmarks.
Auto-pilot includes a language for describing a series of benchmarks
using a simple syntax that includes basic loops and conditionals. The
Auto-pilot distribution includes a set of scripts for several compile
benchmarks and also for running multiple concurrent Postmark processes
[12].
Auto-pilot also provides useful analysis tools that handle
multi-process benchmarks that can also account for background
processes or kernel threads.
Auto-pilot can automatically stop the benchmarks after reliable
results are obtained, highlight outlying values, and detect memory
leaks. Results are presented in a tabular format that can easily be
imported into spreadsheets. Auto-pilot also includes a bar and line
graph script that generates graphs from the tabular results using
Gnuplot.
One of the most frustrating tasks when benchmarking is deciding how
many times to run a test. The ideal situation is to run the benchmark
precisely as many times as needed to obtain stable results, but not
any more than that (to save time for both the benchmarker and to free
the testbed for more tests).
Auto-pilot can automatically determine when test results have met an
arbitrary stability condition (e.g., the half-width of the confidence
interval is within 5% of the mean) and stop the tests at that point.
Benchmarking is often used to debug software. Software may leave some
state behind that affects future results. For example, a kernel
module may have small memory leaks that eventually exhaust system
resources. Auto-pilot uses linear regression to determine if there
are memory leaks (which reduce the total amount of free memory) , or a
performance degradation after each iteration of the benchmark.
Even software that works correctly changes the state of the system.
For example, a working set of files is loaded into OS caches. Often,
researchers unmount and remount the file system to provide cold cache
results, but rebooting has measurable advantages over simply
remounting the file system. Unfortunately, rebooting usually adds
time-consuming manual intervention to the benchmarking process.
To ensure a consistent system state, Auto-pilot provides checkpointing
support. Checkpointing and rebooting is fully automated: all
Auto-pilot state is written to a file, the machine restarts, and after
system initialization completes Auto-pilot resumes the benchmarks from
where it left off.
Systems have a long life cycle and benchmark results may need to be
analyzed months or years after they were taken (e.g., after a paper is
accepted, reviewers often ask questions about the performance
evaluation). Complete results must be saved for future analysis in a
meaningful way. Auto-pilot carefully stores relevant system
information and all program output.
The rest of this paper is organized as follows. We describe previous
work in Section 2. In Section 3 we
describe the design and implementation of Auto-pilot. We conclude in
Section 4.
2 Background
There are many metrics and benchmarks available to test systems. In
this section we describe a few notable systems and how they differ
from Auto-pilot.
Several tools seek to measure precisely (down to microseconds,
nanoseconds, or CPU cycles) the amount of time it takes to perform a
single operation. Two examples of these tools are lmbench
[14] and hbench:OS [5]. These
tools include both a set of tests, and also analysis tools for
these specific tests.
For example, lmbench measures latency and bandwidth for memory, IPC,
file system operations, disk I/O, cached I/O, TCP, UDP, and RPC.
Several O/S primitives are also measured by lmbench, including system
call entry, context switching, signal handling, process creation, and
program execution (fork+exec). These precise measurements
are useful to debug parts of a system, but they do not measure the
interactions between system calls that exist in more realistic
workloads.
The lmbench suite contains not only the infrastructure to run and
report these benchmarks, but defines the tests as well.
In contrast, for Auto-pilot we focus on running relatively large
scale tests (whole programs), like Postmark, a compile, or
micro-benchmarks that perform some operation many times. For example,
we have used Auto-pilot to benchmark specific file system operations
like stat and readdir by running find over
a tree of files.
Brown and Seltzer developed hbench:OS, which is a modified version of
lmbench that improves timing and statistical methodology, adds more
parameters to tests, and improves individual benchmarks.
In lmbench many tests are run in a loop and a final result is
calculated based on all the runs, but some tests are only run once.
Because some architectures have coarse-grained timing infrastructures,
running the test may produce inaccurate results (e.g., 0 microseconds
to perform an operation like a TCP connect). To remove this
deficiency, hbench:OS uses a self-scaling loop that runs the test for
at least one second, which is several orders of magnitude more than
even the worst timing mechanisms. For tests that can be run only
once, hbench:OS uses CPU cycle counters.
Different methods are used to report results in lmbench and hbench:OS.
For some lmbench tests a mean is reported, for others a minimum. In
hbench:OS each individual measurement is recorded so that data
analysis is separated from reporting. In hbench:OS, n%
trimmed means are used for all results. The lowest and highest
n% results are discarded, and the remaining (100 - 2n%)
results are used to compute an arithmetic mean. Whether trimmed means
are a better method for results analysis is disputed by the lmbench
authors, but because hbench:OS stores raw results, different types of
analysis are still possible.
Overall, hbench:OS and Auto-pilot are different for the same reasons
lmbench and Auto-pilot are different: we focus on large general
purpose benchmarks, whereas these two systems focus on small
micro-benchmarks. However, in Auto-pilot we have made some similar
decisions to hbench:OS for reporting and analysis. In Auto-pilot, we
record all results and test output. Auto-pilot is also flexible with
support for arbitrary metrics (e.g., elapsed time, I/O operations, or
packets sent). Our analysis tools can then operate on the raw output
to produce reports and graphs. Like hbench:OS, Auto-pilot can also
automatically scale benchmarks to the testbed (e.g., run a benchmark
for one hour or until the confidence interval's half-width meets a
threshold).
Profilers and other tools measure how long specific sections of code
are executed (e.g., functions, blocks, lines or instructions)
[3,9]. Profilers can be useful because they often tell
you how to make your program faster, but the profiling itself often
changes test conditions and adds overhead, making it unsuitable for
comparing the performance of two systems. The Perl Benchmark::Timer
module [10] times sections of Perl code within a
script. Before the code section, a start function is called; and
after the section an end function is called. Benchmark::Timer can run
a code section for a fixed number of times, or alternatively until the
width of a confidence interval meets some specified value. Auto-pilot
can use similar methodology to determine how many iterations of a test
should be run.
Other benchmarks like SDET [7] and AIM7 [1] are
system-level benchmarks. Both SDET and AIM7 run a pre-configured
workload with increasing levels of concurrency. The metric for each
benchmark is the peak throughput.
These systems focus on developing a metric, and measuring that
specific metric, not running arbitrary benchmarks.
The closest system to Auto-pilot is Software Testing Automation
Framework (STAF) [11] developed by IBM. STAF is an environment
to run specified test cases on a peer-to-peer network of machines.
Rather than measuring the performance of a given test, STAF aims to
validate that the test case behaved as expected. STAF runs as a
service on a network of machines. Each machine has a configuration
file that describes what services the other machines may request it to
perform (e.g., execute a specific program).
STAF also provides GUI monitoring tools for tests.
The major disadvantage with STAF is that it requires complex setup,
does not focus on performance measurement, and is a heavy-weight
solution for running multiple benchmarks on a single machine
The Open Source Development Lab (OSDL), provides a framework called
the Scalable Test Platform (STP) that allows developers to test
software patches on systems with 1-8 processors [13]. STP
allows developers to submit a patch for testing, and then
automatically deploys the patch on a system, executes the test, and
posts the results on a Web page. STP makes it relatively simple to
add benchmarks to the framework, but the benchmarks themselves need to
be changed to operate within the STP environment.
Auto-pilot is different from STP in two important ways. First, STP is
designed for many users to share a pool of machines, whereas
Auto-pilot is designed to repeatedly run a single researcher's set of
tests on a specific machine. Second, STP provides no analysis tools;
it simply runs tests and logs the output, whereas Auto-pilot measures
processes and provides tools to analyze results.
3 Design
To run a benchmark, you must write a configuration file that describes
which tests to run and how many times. The configuration file does
not describe the benchmark itself, but rather points at another
executable. This executable is usually a small wrapper shell script
that provides arguments to a program like Postmark or a compile
benchmark. The wrapper script is also responsible for measurement.
We provide sample configuration files and shell scripts for
benchmarking file systems. These can be run directly for common file
systems, or easily adapted for other types of tests.
Given a configuration file and shell scripts, the next step is to run
the configuration file with Auto-pilot. Auto-pilot parses the
configuration file and runs the tests, producing two types of logs.
The first type is simply the output from the programs. This can be
used to verify that benchmarks executed correctly and to investigate
any anomalies. The second log file is a more structured results file
that contains a snapshot of the system and the measurements that were
collected.
The results file is then passed through our analysis program,
Getstats, to create a tabular report. Optionally, the tabular
report can be used to generate a bar or line graph.
In Section 3.1 we describe auto-pilot, the
Perl script that runs the benchmarks and logs the results. In Section
3.2 we describe the sample shell scripts specific to the
software being benchmarked. In Section 3.3 we describe
Getstats, which produces summaries and statistical reports of the
Auto-pilot output. In Section 3.4 we describe our
plotting scripts.
In Section 3.5 we describe and evaluate
checkpointing and resuming benchmarks across reboots. In Section
3.6 we describe using hooks within the benchmarking
scripts to benchmark NFS.
3.1 auto-pilot
The core of the Auto-pilot system is a Perl script that parses and
executes the benchmark scripts. Each line of a benchmark script
contains a command (blank lines and comments are ignored). The
command interface has been implemented to resemble the structure of a
typical programming language. This makes Auto-pilot easy and intuitive
to enhance when writing new benchmarks.
Next, we describe the thirteen primary commands.
TEST
begins a benchmark. The test directive takes between two and four
arguments. The first argument is the name of the test, which is also
used to build the name of the output file. The second argument is the
minimum number of times to run the test. The third and fourth
arguments are optional. The fourth argument specifies a program that
determines if the test should continue. If the program's exit status
is zero, then the benchmark stops otherwise it continues. The third
argument is how many iterations of the benchmark to execute before
rerunning the program specified in the fourth argument. This argument
is useful because it may be more efficient to execute several
iterations of the benchmark between runs of the program rather than
running a potentially computationally intensive program after a single
iteration.
Using a program to determine if tests should continue allows the
benchmark to execute until there are stable results, thereby saving
time on the testbed, and leaving more time for analysis.
Getstats, described in Section 3.3, has support for
arbitrary predicates to determine stability.
The test directive contains SETUP, EXEC, and
CLEANUP directives (described below). Other control
directives are also allowed (e.g., IF directives, variable
declarations, and loops).
THREADS
tells Auto-pilot how many concurrent benchmark processes should be run
at once. This can be used to test the scalability of systems. Our
analysis tools, described in Section 3.3, aggregate the
results from these threads.
EXEC
executes a test. If the THREADS directive is used, then
threads processes are simultaneously executed. The results for each
thread are logged to separate files. Auto-pilot sets the environment
variable APTHREAD to 1 in the first thread, 2 in the second thread,
and N in the n-th thread. This allows each thread to perform
slightly different tasks (e.g., performing tests in different
directories).
SETUP
executes a setup script for a test. Setup scripts are not
multi-threaded, and are used for initialization that is common to all
threads (e.g., to mount a test file system). We also support a
PRESETUP directive that is run only once. One possible use of
PRESETUP is to format a file system only once, and remount it before
each test using a SETUP directive.
CLEANUP
scripts are used to undo what is done in a setup script.
CLEANUP scripts can be used to ensure a cold cache for the
next test. To run a script after all the iterations of the test are
completed, a POSTCLEANUP directive can be used for final
cleanup.
VAR
sets an Auto-pilot variable. Simple variable substitution is
performed before executing each line: %VAR% is replaced
with the value of VAR. These variables are not exposed to
external processes.
ENV
sets an environment variable and the corresponding Auto-pilot
variable. This can be used to communicate with benchmark scripts
without the need for many command-line arguments. Auto-pilot also
replaces $VAR$ with the contents of the environment variable
VAR. This is similar to the export command within the
Bourne shell.
IF is a basic conditional that supports equality,
greater-than, and less-than (and their inverses). If the condition
evaluates to true, then all statements until ELSE or
FI are executed. If the condition is false, then the
optional statements between ELSE and FI are
executed. ELSE-IF blocks are also supported.
WHILE
repeatedly executes a block of code while a certain condition holds
true. The condition syntax WHILE uses is the same as
IF.
FOREACH
assigns multiple values to one variable in turn. This is useful
because often a single test needs to be repeated with several
different configurations.
FOR
is similar to FOREACH, but instead of specifying each value
explicitly, a start, end, increment, and factor are specified. For
example, FOR THREADCOUNT=1 TO 32 FACTOR 2 would execute the
loop with a THREADCOUNT of 1, 2, 4, 8, 16, and 32.
FASTFAIL causes Auto-pilot to abort if one of the
benchmarks may not be successful. If the benchmarks continue, then
they may destroy important state that could lend insight into the
cause of the failure. An optional fastfail script is also
defined, which can be used to send email to the person responsible for
the benchmarks. We have found it very useful to email pagers, so that
testbeds do not remain idle after a failed benchmark.
CHECKPOINT writes all Auto-pilot internal
state to a file. If Auto-pilot is invoked with the checkpoint file as
an argument, then it resumes execution from where it left off. The
return value of CHECKPOINT is similar to the Unix
fork system call. After restoring a checkpoint, the value of
the Auto-pilot variable RESTORE is 1, but after writing the
checkpoint, the value of RESTORE is 0. In Section
3.5 we present and evaluate an in-depth example of
checkpointing across reboots.
Configuration example
Figure 1 shows the Postmark configuration file
included with Auto-pilot.
1  INCLUDE common.inc
2  FOREACH FS ext2 ext3 reiserfs
3    FOR THREADCOUNT=1 TO 32 FACTOR 2
4      THREADS=%THREADCOUNT%
5      TEST %FS%:%THREADS% 10 1 getstats \
  --predicate '("$delta" < 0.05 * $mean) \
  || ($count > 30)'
6        SETUP fs-setup.sh %FS%
7        EXEC postmark.sh
8        CLEANUP fs-cleanup.sh %FS%
9      DONE
10   DONE
11 DONE
12 INCLUDE ok.inc
|
Figure 1: A sample Auto-pilot configuration file
Line 1 includes common.inc, a configuration file that performs
actions that are common to all tests. common.inc also turns
off all excess services (e.g., Cron) to prevent them from interfering
with a benchmark run.
The common.inc file also includes local.inc, which the
user can create to set variables including TESTROOT, which
defines the directory where the test will take place.
Line 2 begins a FOREACH loop. This loop is executed a total
of three times. The first time the value of FS is set to "ext2,"
the second time it is set to "ext3," and on the third it is
"reiserfs."
Line 3 begins a nested loop that will set the THREADCOUNT variable
to 1, 2, 4, 8, 16, and 32.
Line 4 sets the number of threads to use to THREADCOUNT.
Lines 5-9 define the test. The test is named
%FS%:%THREADS%. For example, the first test is named
ext2:1.
The test is executed 10 times, and then after each test the Getstats
program (described in Section 3.3), is used to
determine whether the confidence interval has an acceptable half-width
for elapsed, user, and system time. The test is stopped after 30
runs, to prevent a test from running forever.
Line 6 calls fs-setup.sh with an argument of ext2.
This is our file system setup script, which formats and mounts a file
system (formatting can be disabled with environment variables).
Line 7 executes postmark.sh. This shell script creates a
Postmark configuration, and then executes Postmark through our
measurement facility (described in Section 3.2).
Line 8 unmounts the Ext2 file system, so that the next run takes place
with a cold cache.
Lines 9-11 close their corresponding loops.
Line 12 turns services back on, and optionally sends an email to the
user indicating that the benchmarks are complete.
3.2 Benchmark Scripts
We provide a set of file system benchmarking scripts for Postmark
[12] and compiling various packages. We included
an example script for compiling Am-Utils [15], GCC
[8], and OpenSSL [17]. Most other packages can be
compiled by setting environment variables or with minimal changes to
the existing scripts.
Many applications can be benchmarked without any scripts, but file
systems require complex setup and cleanup. Our scripts also serve as
an example for benchmarking applications in other domains.
We wrote scripts to test some of our complex file systems. These
systems required extensive testing and Auto-pilot allowed us to
methodically test and debug them.
The flow of the scripts is organized as two components. The first
component mounts and unmounts the file system. The second performs
the Postmark or the compile benchmark. Though we distribute scripts
for benchmarking compilations and Postmark on Ext2, Ext3, and
Reiserfs, it is easy to add other benchmarks or platforms. To test
additional file systems, the Auto-pilot scripts have hooks for
mount, unmount, mkfs, tunefs, and
more.
With these hooks, new file systems or new file system features can be
used. We provide example hooks for enabling HTrees on Ext2/3
[16] and to benchmark on top of stackable file systems
[21]. We describe how we used the hooks to
concurrently benchmark an NFS client and server in Section
3.6.
The sample Auto-pilot scripts we distribute demonstrate the following
principles:
- Separating the test and the setup. Most benchmarks involve performing
several workloads on several configurations. Each configuration has
a setup and a corresponding cleanup script. Each workload has a
script common to all configurations.
- Using variables for all values that may change. We additionally have
support for operating system and host-specific options.
- Unmounting the file system on which the benchmark takes place between
runs, even if the previous run failed.
Auto-pilot includes common.inc, which calls
noservices.sh to shut down Cron, Sendmail, Anacron, LPD,
Inetd, and other services on the testbed. If no user is logged in via
SSH, then SSH is also turned off. We create /etc/nologin to
prevent users from logging in while the test is being run. Swap space
is optionally disabled to prevent it from affecting results. All
these actions are taken to avoid unexpected user or system activity
from distorting the results.
The file system setup script loads in machine-specific settings (e.g.,
which device and directory to use). Next, the script logs some vital
statistics about the machine (OS version, CPU information, memory
usage, hard disk configuration, and partition layout). The script
then unmounts any previously-mounted file systems, formats the device,
and mounts the new file system (e.g., Ext2, Ext3, or Reiserfs). This
ensures a clean cache and consistent disk layout. Because vital
machine information is recorded, the test conditions can be reproduced
in the future.
Next, the benchmark is executed. The compile script unpacks,
configures, and compiles the package specified. The compile commands
are run through a function named ap_measure.
This function produces a block of information that encapsulates
the results for this test. By default, the block includes the
iteration of the test, which thread was running, the elapsed time, the
system CPU time, the user CPU time, and the command's exit status.
When analyzing the results, this block logically becomes a row in a
spreadsheet.
Additional fields can be added through the use of measurement hooks.
Measurement hooks are executed before and after the test. Each hook
can produce values to be included in the block. We provide sample
hooks that measure the number of I/O requests for a given partition;
the amount of free memory; the amount of CPU time used by
background processes; network utilization; and more.
Programs such as CFS [4] or Cryptoloop
[18] use a separate thread for some processing.
Even if the instrumented process itself does not have additional
threads, the kernel may use asynchronous helper threads to perform
certain tasks (e.g., bdflush to flush dirty buffers or
kjournald to manage journalized block devices).
This hook allows measurement of daemons that expend effort
on behalf of the measured process. The measurement hook is also
called one final time so that it can produce its own blocks. This
feature is used for the CPU time difference measurement hook to
enumerate all processes that used additional CPU time. Our I/O
measurement script also adds a block with the number of I/O operations
that occurred on each partition.
The Postmark script is more complicated because it can run several
Postmark processes in parallel. When running a multithreaded test,
Auto-pilot sets two environment variables: APTHREAD and APIPCKEY.
APTHREAD is the thread number for this test. APTHREAD can be
used, for example, so that different processes use different
directories. APIPCKEY is used for synchronization. First,
the Postmark script creates a directory and then sets up a Postmark
configuration file. Because Auto-pilot starts each test sequentially,
one test could start before another and then the timing results would
be inaccurate. To solve this, Auto-pilot creates a System V semaphore
with the number of threads as its value. Before executing Postmark,
each test script decrements the semaphore. We include a small C
utility that calls semctl to decrement the semaphore. All of
the test processes are suspended until the semaphore reaches zero, at
which point they all begin to execute concurrently.
After all the benchmark processes complete, Auto-pilot executes the
cleanup script, which unmounts the file system. After all tests are
executed successfully, SSH is restarted and /etc/nologin is
removed. This is not meant to restore the machine to its previous
state, but rather to allow remote access, so that the benchmarker can
retrieve results, or begin another series of benchmarks. Auto-pilot
does not keep track of which services it stopped. To restore
the services the machine was running before the benchmarks, it can
simply be rebooted.
ext2:1.res: High z-score of 2.21853230276562 for elapsed in epoch 3.
...
ext2:1.res
NAME     COUNT   MEAN MEDIAN    LOW   HIGH    MIN    MAX SDEV%   HW%
Elapsed     10  6.055  6.063  5.991  6.120  5.855  6.180 1.491 1.067
System      10  2.758  2.760  2.709  2.807  2.640  2.880 2.499 1.788
User        10  1.675  1.680  1.615  1.735  1.510  1.820 5.044 3.609
Wait        10  1.622  1.636  1.567  1.677  1.465  1.718 4.759 3.404
CPU%        10 73.221 73.079 72.572 73.871 72.007 74.981 1.240 0.887

ext3:1.res
NAME     COUNT   MEAN MEDIAN    LOW   HIGH    MIN    MAX SDEV%   HW%      O/H
Elapsed     15 77.861 76.865 74.156 81.567 64.308 88.209 8.594 4.759 1185.869
System      15  4.272  4.290  4.217  4.327  4.100  4.410 2.334 1.293   54.895
User        15  1.825  1.820  1.773  1.877  1.670  1.990 5.132 2.842    8.935
Wait        15 71.765 70.775 68.064 75.466 58.158 82.179 9.312 5.157 4324.025
CPU%        15  7.885  7.923  7.499  8.272  6.836  9.563 8.850 4.901  -89.231
|
Figure 2: The Getstats tabular report format showing
the results for Postmark with a single thread on Ext2 and Ext3.
3.3 Getstats
Getstats is a Perl script which processes the results log file to
generate useful tabular reports. In addition to Auto-pilot results
files, Getstats can process Comma Separated Value (CSV) files or the
output of GNU time. Getstats is flexible in that it does not
hardcode the types of information it expects in these files; it simply
reads and displays the data.
The parsers themselves are also modular. Getstats searches the Perl
library path for valid Getstats parsers and loads them. To write a
new parser, two functions must be defined: a detection function and a
parsing function that reads the input file into a two-dimensional array.
We originally used this functionality to add support for GNU time
files, but have also used it for some of our own custom formats.
We discuss mostly timing information, but we have also analyzed
network utilization, I/O operations, memory, and other quantities with
Getstats.
Getstats has a basic library of functions to transform the data. Examples
of transformations include adding a column derived from previous
values, selecting rows based on a condition, raising warnings,
grouping data based on the value of a column, or aggregating data from
multiple rows to produce a single summary statistic.
If Getstats detects that it is being run on results files with time
data, it performs some default transformations composed of the basic
library transformations. These include raising warnings if a command
failed, aggregating multiple threads into a single value, computing a
wait time (the time the measured process was not running) and a
CPU-utilization column, raising warnings if any test had a high
z-score for one if its values, computing overheads, and finally
generating a tabular report.
Figure 2 shows a tabular report generated by
Getstats compares Ext2 with Ext3, when run on the Postmark
configuration discussed in Section 3.1.
The first line of the report is a high z-score warning for the third
iteration of ext2 with one thread. If there are tests with very large
z-scores, then there likely were problems with the benchmark.
A few other high z-score warnings were issued, but are not shown to
conserve space. Of note is that Ext2 ran only ten times, but Ext3
needed to run 15 times to get an acceptable half-width percentage for
the measured quantities (the predicates are not run for Wait and CPU%
which are computed quantities). This is not unexpected because
journaling adds complexity to the file system's I/O pattern, resulting
in greater variability [6].
The tabular format itself is useful as a mechanism to present
detailed results or to import data into spreadsheets, but graphs
present a better overall picture of the results.
Output Modes
Getstats provides several useful options to analyze and view different
output modes. The simplest mode outputs the raw uninterpreted values,
which is useful when there are problems with the benchmark (e.g., one
run had anomalous results).
The tabular report also has information useful for plotting. The
LOW and HIGH columns are suitable for creating error
bars with Gnuplot.
Getstats supports several methods of creating error bars: Student-t
confidence intervals, the minimum and maximum value, or the standard
deviation. By default Getstats reports the count, mean, median,
minimum, maximum, and Student-t confidence interval error bar values
(shown as low and high), and the standard deviation and half-width of
the confidence interval as a percent of the mean.
The standard deviation is a measure of how much variance there is in
the tests. The half-width of the confidence interval describes how
far the true value may be from the mean with a given degree of
confidence (by default 95%).
If multiple results files are specified, then the first file is used
as a baseline to compute overheads for the subsequent files (this is
shown as "O/H").
This report gives a high-level yet concise overview of a test.
chill
NAME    COUNT MEAN   MEDIAN LOW    HIGH   MIN    MAX    SDEV% HW\%
Elapsed 10    38.649 38.193 37.950 39.348 37.673 40.379 2.528 1.808
System  10    1.663  1.675  1.603  1.723  1.540  1.770  5.071 3.628
...
remount
NAME    COUNT MEAN   MEDIAN LOW    HIGH   MIN    MAX    SDEV% HW\%   O/H
Elapsed 10    38.751 38.699 38.580 38.921 38.465 39.307 0.614 0.439 0.262
System  10    1.796  1.790  1.677  1.915  1.580  2.080  9.255 6.620 7.998
...
Comparing remount (Sample 1) to chill (Sample 2).
Elapsed: 95%CI for remount - chill = (-0.567, 0.769)
Null Hyp. Alt. Hyp. P-value Result
u1 <= u2  u1 >  u2  0.377   ACCEPT H_0
u1 >= u2  u1 <  u2  0.623   ACCEPT H_0
u1 == u2  u1 != u2  0.754   ACCEPT H_0

System: 95%CI for remount - chill = (0.009, 0.257)
Null Hyp. Alt. Hyp. P-value Result
u1 <= u2  u1 >  u2  0.018   REJECT H_0
u1 >= u2  u1 <  u2  0.982   ACCEPT H_0
u1 == u2  u1 != u2  0.037   REJECT H_0
...
|
Figure 3: The Getstats t-test output. User time, Wait time, and CPU usage are omitted for brevity.
Statistical Tests
After changing your software you would like to know if your changes
actually had a measurable effect on performance (or some other
measured quantity).
In some cases it is sufficient to compare the means, and if they are
"close", then you may assume that they are the same or that your
change did not noticeably affect performance. In other circumstances,
however, a more rigorous approach should be used. For example, if two
tests are very close, it can be difficult to determine if there is
indeed a difference, or how large that difference really is.
To compare two samples, Getstats can compute the confidence interval
for the difference between the means, and can also run a two-sample
t-test. The confidence interval quickly tells you if there is a
difference, and how much it is. The confidence interval is simply a
range of numbers. If that range includes zero, then the samples are
not significantly different.
Getstats also can run a two-sample t-test to determine the
relationship between two results files. A statistical test has a
null hypothesis, which is assumed to be true. An example of a
null hypothesis is u1 = u2. The result of a t-test is a P-value,
which is the probability that you would observe the data if the null
hypothesis is true.
If the P-value is large (close to 1), then your data is consistent
with the null hypothesis. If the P-value is small (closer to 0), then
your data is not consistent with the null hypothesis.
If the P-value is smaller than a predetermined significance level
(e.g., .05), then you reject the original assumption (i.e., the null
hypothesis).
Figure 3 shows the output of a Getstats t-test
for two samples: CHILL and REMOUNT. We ran a
recursive grep benchmark over the GCC 3.4.3 source tree.
For CHILL we ran a program that we wrote called chill
that is designed to ensure cold-cache results. Our version of chill
was inspired by a similar program in SunOS 4 [20]. Chill
allocates and dirties as much memory as possible, thereby forcing the
kernel to evict unused objects. We hypothesized that chill would
provides more stable results than simply unmounting the test file
system, because it causes all caches to be purged, not just those
related to the test file system.
The REMOUNT configuration unmounts the file system and then
mounts it again instead of running chill.
From the tabular report, we can see that elapsed time
differs by only 0.262%, and system time differs by only 7.998%. After
the tabular report, each measured value in the samples is compared
(e.g, elapsed time from the first sample is compared to elapsed time
from the second sample).
If we examine the confidence interval for the elapsed time, we can see
that it includes zero (the beginning of the range is less than zero,
but the end of the range is greater than zero), which means that
CHILL and REMOUNT are not distinguishable. The next
four lines show the results of the t-test for elapsed time.
Getstats runs the t-test with three distinct assumptions: u1 < =
u2, u1 > =u2, and u1 = u2. For simplicity, we chose to
display all of the tests rather than forcing the user to specify the
tests of interest. It is up to the benchmarker to determine which of
these assumptions makes sense. In all cases, the P-value was higher
than the significance level of (0.05), which means that we can not
reject the assumptions with 95% confidence. Therefore, we conclude
that
CHILL and
REMOUNT are indistinguishable for elapsed time.
For system time, the confidence interval does not contain zero, which
means the two tests have a significant difference. This is supported
by the P-value, which shows us that there is only a 3.7% chance of
observing this data if the two samples were in fact equal. There is
also only a 1.8% chance that CHILL uses less system time
than REMOUNT. Because 3.7% and 1.8% are less than the
significance level, we can reject the null hypothesis that u1 = u2
and that u1 < =u2 where u1 represents REMOUNT and
u2 represents CHILL. Because our assumption that
REMOUNT used less system time than CHILL is false,
we know that REMOUNT did use more system time because it
needed to recreate objects that the kernel evicted.
Detecting Anomalies
Often, one or two bad runs are not noticeable from summary statistics
alone. Getstats provides two mechanisms for finding anomalous
results:
- Automatically highlighting outlying values
- Performing linear regression on the values
To automatically highlight outlying values, Getstats uses the
z-score of each point. The z-score is the difference between the
value and the mean, divided by the standard deviation. If the
z-score is greater than a configurable value (by default 2), a
warning is printed before the summary statistics. The benchmarker can
then look into the results further to analyze the cause of the
outliers.
Getstats can also compute a least-squares linear regression to fit the
elapsed time, system time, user time, and free memory. Linear
regression computes the slope and intercept of the line that best fits
a set of points. If the results are stable, then the slope of these
should be zero. The intercept is just the magnitude of the values, so
it is unimportant. If the magnitude of the slope is not close to
zero, then a warning is issued.
If the free memory slope is negative, then it indicates that on each
iteration the software is leaking memory. If the elapsed or CPU times
have positive slopes, it similarly indicates that some resource is becoming
more scarce, and causing a gradual performance degradation.
Depending on the system being analyzed, different thresholds are
appropriate, so the default value can be overridden by the
benchmarker.
To ensure that the amount of free memory reported is accurate,
we run our version of chill. Chill allocates as much memory as
possible, then dirties every page. Chill is terminated by the Linux
out-of-memory manager (or when malloc can no longer get
additional memory). At this point the kernel has evicted objects and pages
to make room for chill, and the amount of memory consumed should be at
a minimum.
Predicate Evaluation
Getstats evaluates predicates for use with auto-pilot's
TEST directive. Getstats runs the predicate over each column
in the results file, and returns zero if the predicate is true.
The predicates are flexible. Getstats replaces several statistical
variables (e.g., mean, median, half-width of the confidence interval,
standard deviation, number of tests, and the slope of the linear regression)
with their actual values and then passes the predicate to Perl's
eval function. This combination of substitution and eval
allows arbitrarily complex predicates using simple math or Perl
functions.
For example, the statement "0.05 * $mean < $delta" returns true if the half-width of the Student-t
confidence interval is less than 5% of the mean.
Combining Results
Benchmarks often have too many numbers for a user to interpret, so
Auto-pilot automatically combines results in two specific cases:
- Benchmarks that consist of multiple programs (e.g.,
compilations)
- Multi-threaded benchmarks
Some benchmarks consist of multiple commands. For example, to compile
GCC, three steps are required: tar extracts the distribution,
./configure detects information about the environment, and
finally make builds the package.
Getstats unifies the results of each command into one result per
benchmark execution. Alternatively, the user can use a select
transformation to analyze one specific command in isolation.
When analyzing multi-threaded data, Getstats aggregates all of the
threads in one test together to create a single set of results for the
test. The elapsed time that is reported is the longest running thread
and the system and user times are the sum of the system and user times
for each thread.
This allows a benchmark that is usually single-threaded to be run and
analyzed in a multi-threaded manner.
3.4 Plotting Tools
One of the most useful ways to present benchmark data is through the
use of graphs. In our experience, it is desirable to have
automatically-generated graphs in Encapsulated Postscript (EPS)
format, so the graphs are more suitable for publication. Our
requirement for automatic graph generation essentially dictates that
we use a command-line tool.
We have found Gnuplot to be the most flexible plotting package, but
its interface is cumbersome, often requiring dozens of lines of code
and a specific data format to create a simple plot. Auto-pilot uses a
wrapper script, Graphit, that generates both line and bar
charts using Gnuplot.
Although Gnuplot is our preference, everyone has their own
favorite plotting tool. Each plotting wrapper script is specific to the
plotting tool used, but Getstats can produce CSV output which can
easily be imported into other programs (e.g., Excel).
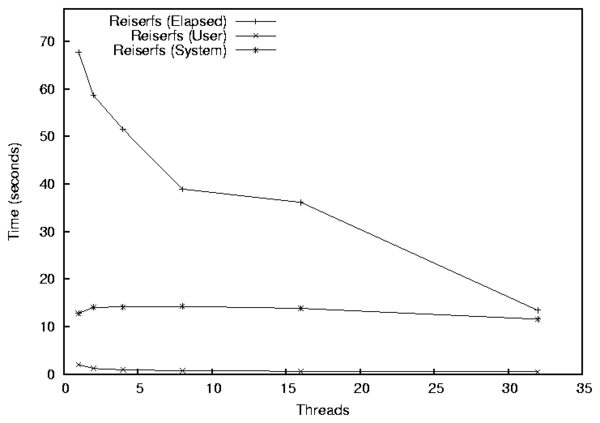 Figure 4: The results for Postmark on Reiserfs, 1-32 threads
A sample line graph can be seen in Figure 4.
This graph shows the results from Postmark running on top of Reiserfs
with 1-32 threads.
The elapsed time decreases as threads are added, because the kernel
can better schedule I/O operations. However, the user and system CPU
time remained relatively constant because the same amount of work is
being done.
This graph was generated with the following command line:
Figure 4: The results for Postmark on Reiserfs, 1-32 threads
A sample line graph can be seen in Figure 4.
This graph shows the results from Postmark running on top of Reiserfs
with 1-32 threads.
The elapsed time decreases as threads are added, because the kernel
can better schedule I/O operations. However, the user and system CPU
time remained relatively constant because the same amount of work is
being done.
This graph was generated with the following command line:
graphit -mode=line \
  -components=Elapsed,User,System \
  -graphfile=reiserfs-pm.eps \
  -k 'top right' -f 17 \
  -xlabel Threads -ylabel "Time (seconds)"  \
  Reiserfs 'reiserfs:*.res'
The mode argument specifies a line graph (the other supported mode is
a bar graph). The -components parameter informs Graphit which
quantities are of interest. The -graphfile parameter specifies
an output file. The next three parameters are optional: -k
specifies the legend location (Gnuplot refers to the legend as a key);
-f increases the font size to 17 points; and xlabel and ylabel
specify axis labels. The last two parameters define a series. In
this case it is named Reiserfs, and the values are from the files
named
reiserfs:*.res.
This command line replaces an 11 line Gnuplot script, with 566
characters (a savings of 70%). More importantly, Graphit
creates a properly-formatted Gnuplot data file for the actual series.
Creating bar graphs in Gnuplot is not straightforward. Rather than
defining series and values as is done in other plotting tools, you
must create an artificial x-axis and locate each bar and its label
along this axis.
To properly space and locate these bars without automated tools is
tedious. Graphit automatically constructs this artificial x-axis and
spaces the bars appropriately. Using command-line arguments, the
width of the bars, the gap between each bar, the gap between each
group of bars, and several other parameters can be controlled easily.
An example Graphit bar graph is shown in Figure
5. This graph shows the same Postmark
results for Ext2, Ext3, and Reiserfs that are shown in Figures
2 and 4.
Graphit automatically reads the results files, stacks user CPU time
over system CPU time; determines bar widths, spacing, and error bars;
formats a Gnuplot data file; generates a Gnuplot script; and
finally runs Gnuplot. We ran the following command to generate the graph:
graphit -mode=bar \
  -ylabel `Time (seconds)' -f 17 \
  -components=Elapsed,User,System \
  -graphfile=pm.eps Ext2 ext2:1.res \
  Ext3 ext3:1.res Reiserfs reiserfs:1.res
This single command replaces a 15-line 764-character Gnuplot script,
and, more importantly, generates a data file with appropriate spacing
along the artificial axis. Graphit has several spacing options to
control the width of each bar, the gap between bars (e.g., System and
User could be next to each other), and the gap between sets of bars
(e.g., Ext2 and Ext3). Figure 6 is another example
Graphit bar graph using the same options but with more data sets, so
the bars are thinner. We also passed "-rotate 45" to Graphit
to rotate the X-axis labels.
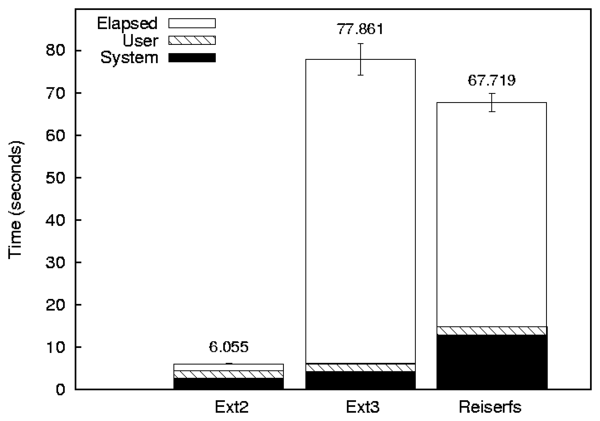 Figure 5: Postmark on Ext2, Ext3, and Reiserfs.
3.5 Checkpointing Across Reboots
Operating system code behaves very differently when data is already
cached (called a warm cache) and when data is not yet in the cache
(called a cold cache). This concern is particularly acute for file
systems, which depend on caches to avoid disk or network operations,
which are orders of magnitude slower than in-memory operations.
Creating a warm cache situation is relatively easy: to create n warm
cache runs, you can run the test n+1 times in sequence and discard
the first result, which is only used to warm the cache.
However, testing a cold cache situation is more difficult. For a
perfectly cold cache, all OS objects must be evicted from their caches
between each test. For file systems research, researchers unmount the
test file system between each test. This invalidates inodes,
directory name lookup caches, and the page cache for the tested file
system. Unfortunately, this approach has two key disadvantages.
First, even though inodes (and other objects) are invalidated, they
may not be deallocated. This can expose subtle bugs when inodes are
not properly cleared before reuse. The second problem is that the
kernel often keeps a pool of unused objects for faster allocation, so
the second run may use less system time because it does not need to
get raw pages for object caches. For these two reasons, we have
additionally run our version of chill, described in Section
3.3, to deallocate these objects.
To get a truly cold cache, a reboot is required because all operating
state is reset after a reboot. The disadvantage of a reboot is that
it takes a long time and usually requires manual intervention. We
have designed Auto-pilot so that it can serialize all of its state
into a plain text file using the CHECKPOINT directive. The
CHECKPOINT directive is similar to UNIX fork in that it sets
a variable to "0" after writing a checkpoint, but the variable is
set to "1" after resuming from where the checkpoint left off. After
writing a checkpoint, an Auto-pilot script can reboot the machine.
After the machine's initialization process completes (at the end of
/etc/rc.d/rc.local), we check whether the checkpoint file exists.
If the checkpoint file exists, is owned by root, and is not
world-writable, then we start Auto-pilot and it resumes from where
benchmark execution left off.
We wanted to quantify the differences between various methods of
cooling the cache. We ran a recursive grep -q benchmark over
the GCC 3.4.3 source tree. We chose grep because it is a simple
read-oriented benchmark, yet has a significant user component. We
used the six following configurations:
- Sequential
- The benchmark is run repeatedly with a warm cache.
- Chill
- Chill is run between each iteration of the benchmark.
- Remount
- The test file system is remounted between each iteration of the benchmark.
- Remount+Chill
- The test file system is remounted between each iteration of the benchmark.
- Reboot
- The machine is rebooted between each iteration of the benchmark.
- Reboot+Chill
- The machine is rebooted and Chill is run between each iteration of the benchmark. We used this configuration because the initialization process after reboot may have caused some objects to be loaded into the cache, and chill may evict them.
All tests were run on a 1.7Ghz Pentium IV with Fedora Core 2 and a
vanilla 2.4.23 kernel. The test partition was on a Western
Digital 5,400 RPM IDE disk. Each test was run 10 times. The elapsed,
system, and user time results are shown in Figure 6, and
the error bars show the 95% confidence intervals for elapsed time.
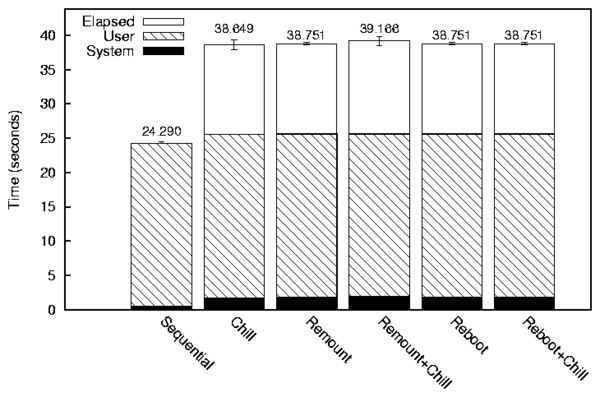 Figure 6: grep -r with various cache-cooling methods.
In all cases user time differences were indistinguishable. This was
expected, because grep's processing does not change with the
different configurations. The Sequential configuration had the lowest
elapsed and system time, because it does not need to perform any I/O
to read objects from disk.
For Chill and Remount, System time was not distinguishable, but Chill
used 13% less system time, so remounting is a more effective way of
cooling the cache. Remount+Chill is indistinguishable from remount.
Reboot was 4.3% slower than remounting the file system, and system
time was indistinguishable.
Reboot is not distinguishable from Reboot+Chill. Therefore we conclude
that rebooting the system is in fact the best method of cooling the
cache.
Figure 6: grep -r with various cache-cooling methods.
In all cases user time differences were indistinguishable. This was
expected, because grep's processing does not change with the
different configurations. The Sequential configuration had the lowest
elapsed and system time, because it does not need to perform any I/O
to read objects from disk.
For Chill and Remount, System time was not distinguishable, but Chill
used 13% less system time, so remounting is a more effective way of
cooling the cache. Remount+Chill is indistinguishable from remount.
Reboot was 4.3% slower than remounting the file system, and system
time was indistinguishable.
Reboot is not distinguishable from Reboot+Chill. Therefore we conclude
that rebooting the system is in fact the best method of cooling the
cache.
3.6 Benchmarking Script Hooks for NFS
We have found that we continually enhance our Auto-pilots benchmarking
scripts, yet each project often needs its own slightly different setup
and cleanup mechanisms or needs to measure a new quantity. For
example, our tracing file system needed to measure the size of the
trace file that each test generated [2]. This made
the scripts hard to maintain. Projects that were started earlier
used older modified versions of the benchmarking scripts. As the
scripts improved, these older projects would have progressively more
out of date scripts.
Recently, we have redesigned Auto-pilot's benchmarking scripts to be
extensible and provide hooks in critical locations. Our goal was to
allow developers to test new file systems and add new measurements to
the benchmarking scripts, without having to modify the originals.
To do this, Auto-pilot automatically reads in all files in
$APLIB/commonsettings.d ($APLIB is an environment
variable that is set to the path where the scripts were installed, but
additional paths can be added to it). These files define hooks for
various events such as mounting a file system, unmounting a file
system, beginning a measurement, and ending a measurement.
We prototyped a modified NFS client and server, and therefore did not
use the standard NFS benchmark, SPEC-SFS [19], because it does
not use the local client (it hand-crafts RPCs instead). To benchmark
our modified client and server, we used Auto-pilot to run standard
file system benchmarks, such as Postmark.
We have included the hooks we used for this project as an example of
what can be done with our hooks.
The simplest hook we have adds support for mounting an NFS file
system. The hook requires two environment variables to be set
(the server and the path to mount on the server). The hook also loads
and unloads the NFS file system module (unless it is built into the
kernel).
Because we were running a modified NFS server, we needed to
coordinate with the server and measure the CPU time used by the NFS
server (it does not make sense to measure elapsed time, because the
server runs for precisely as long as the client). To coordinate
between the client running the benchmarks and the server, we used SSH
to run remote commands on the server. This follows the same model
that SPEC SFS uses, but replaces RSH using rhosts with SSH
using public-key based authentication.
In the mount hook, we copy the module to the server and then restart
it. In the unmount hook we unload the module. We also added a remote
process measurement hook. Each time a client process is measured, we
run a command on the NFS server to record the amount of CPU time used
by nfsd. After the client process is terminated, we run another
command on the server to report the difference in CPU time used.
The current scripts make it relatively easy to benchmark one client
machine accessing one server, which is a relatively common
benchmarking case. If you wanted to benchmark one server with
multiple clients, then you would need to write new scripts in which
the server runs Auto-pilot and remotely executes the benchmark on the
clients. The server-side scripts would need to be written from
scratch, but the client-side scripts could be very similar to the
current Auto-pilot benchmarking scripts.
4 Conclusion
Auto-pilot provides a useful set of tools for accurately and
informatively benchmarking software.
Auto-pilot configurations are powerful scripts that describe a series of
tests, including multi-threaded versions of traditional benchmarks.
Auto-pilot includes sample scripts for various compile-based
benchmarks and Postmark. Auto-pilot's flexible infrastructure allows
many other tests and measurements to be added. For example, we
include hooks for testing over NFS, measuring I/O operations and CPU
time used by background processes. We have also used many different
benchmarks aside from the ones included in the package (e.g.,
grep and other custom benchmarks).
We present results in an informative manner that can easily be used
with Gnuplot. Getstats generates easy-to-read tabular reports,
automatically displays outlying points, detects memory leaks, and runs
statistical tests. In combination with Auto-pilot, Getstats can
evaluate predicates to run tests until an arbitrarily complex
condition is satisfied, thereby saving time on the testbed.
Graphit processes results files and automatically creates Gnuplot
scripts with properly formatted data files to create bar and line
graphs.
Auto-pilot can checkpoint its state, reboot the machine, and resume
running tests from where it left off. Rebooting provides a colder
cache than simply remounting the file system, and requires no manual
intervention on the part of the benchmarker. When benchmarks fail,
Auto-pilot can automatically send email or text pages to the
benchmarker to prevent the testbed from lying idle.
We have used Auto-pilot for over three years and for eighteen
projects. Auto-pilot saved us many days of work in collecting
performance results and reduced debugging cycles by exposing bugs more
quickly.
Auto-pilot is released under the GPL and can be downloaded from
ftp.fsl.cs.sunysb.edu/pub/auto-pilot/.
Auto-pilot contains 5,799 lines of code. The Auto-pilot Perl script
has 936 lines; Getstats has 1,647 lines; Graphit has 587
lines; the C utilities have 758 lines; the configuration files have
221 lines; and our shell scripts have 1,650 lines. All of our Perl
scripts also have basic Perldoc formatted documentation that provides
information on simple usage. We also include a full user manual that
describes more detailed usage and has some brief tutorials in PDF and
GNU info formats.
4.1 Future Work
We plan to add support for regular system snapshots, which can then be
correlated with the output of the tests. This will allow a person
conducting benchmarks to determine the context that the test was executed
in. These snapshots will include kernel messages, memory usage, CPU
usage, and other vital statistics.
Getstats currently uses a two-sample t-test to compare different
results files. A t-test makes three assumptions:
- The samples are independent
- The samples are normally distributed
- The samples have equal variance
Auto-pilot scripts attempt to ensure that each sample is independent
of the other samples by purging cached data through remounting and
rebooting. The last two assumptions must currently be verified by the
benchmarker. If the sample size is sufficiently large (roughly
greater than 30 samples), the t-test will still be appropriate. The
third assumption must still be verified. We plan to automatically run
an F-test on the variances. If the test concludes that the
variances are not equal, then Getstats will use an approximate
t-test for samples with unequal variances instead of the standard
t-test.
Acknowledgments
Joseph Spadavecchia developed the first simple version of our
benchmarking Perl script that has since morphed into the current
Auto-pilot.
Amit Purohit, Kiran-Kumar Muniswamy-Reddy, Michael Martino, Avishay
Traeger, and others in our group have provided valuable feedback when
using the system to benchmark their projects.
This work was partially made possible by NSF CAREER award
EIA-0133589, NSF Trusted Computing Award CCR-0310493, and HP/Intel
gift numbers 87128 and 88415.1.
References
- [1]
-
AIM Technology.
AIM Multiuser Benchmark - Suite VII Version 1.1.
http://sourceforge.net/projects/aimbench, 2001.
- [2]
-
A. Aranya, C. P. Wright, and E. Zadok.
Tracefs: A File System to Trace Them All.
In Proceedings of the Third USENIX Conference on File and
Storage Technologies (FAST 2004), pages 129-143, San Francisco, CA,
March/April 2004.
- [3]
-
Bell Laboratories.
prof, January 1979.
Unix Programmer's Manual, Section 1.
- [4]
-
M. Blaze.
A cryptographic file system for Unix.
In Proceedings of the first ACM Conference on Computer and
Communications Security, 1993.
- [5]
-
A. Brown and M. Seltzer.
Operating System Benchmarking in the Wake of Lmbench: A Case Study
of the Performance of NetBSD on the Intel x86 Architecture.
In Proceedings of the 1997 ACM SIGMETRICS Conference on
Measurement and Modeling of Computer Systems, pages 214-224. ACM Press,
June 1997.
- [6]
-
R. Bryant, R. Forester, and J. Hawkes.
Filesystem Performance and Scalability in Linux 2.4.17.
In Proceedings of the Annual USENIX Technical Conference,
FREENIX Track, pages 259-274, Monterey, CA, June 2002.
- [7]
-
S. Gaede.
Perspectives on the SPEC SDET benchmark.
www.specbench.org/sdm91/sdet/, January 1999.
- [8]
-
The GCC team.
GCC online documentation, 3.3.2 edition, August 2003.
http://gcc.gnu.org/onlinedocs/.
- [9]
-
S. L. Graham, P. B. Kessler, and M. K. McKusick.
Gprof: A call graph execution profiler.
In Proceedings of the 1982 SIGPLAN symposium on Compiler
construction, pages 120-126, June 1982.
- [10]
-
A. Ho and D. Coppit.
Benchmark::Timer - Benchmarking with statistical confidence,
December 2004.
User Contributed Perl Documentation, Section 3.
- [11]
-
IBM.
Software testing automation framework STAF.
staf.sourceforge.net, 2001.
- [12]
-
J. Katcher.
PostMark: A New Filesystem Benchmark.
Technical Report TR3022, Network Appliance, 1997.
www.netapp.com/tech_library/3022.html.
- [13]
-
Open Source Development Labs.
Scalable test platform.
www.osdl.org/lab_activities/kernel_testing/stp/, 2004.
- [14]
-
L. McVoy and C. Staelin.
lmbench: Portable tools for performance analysis.
In Proceedings of the USENIX 1996 Annual Technical
Conference, pages 279-295, January 1996.
- [15]
-
J. S. Pendry, N. Williams, and E. Zadok.
Am-utils User Manual, 6.1b3 edition, July 2003.
www.am-utils.org.
- [16]
-
D. Phillips.
A directory index for EXT2.
In Proceedings of the 5th Annual Linux Showcase & Conference,
pages 173-182, November 2001.
- [17]
-
The OpenSSL Project.
Openssl: The open source toolkit for SSL/TLS.
www.openssl.org, April 2003.
- [18]
-
H. V. Riedel.
The GNU/Linux CryptoAPI site.
www.kerneli.org, August 2003.
- [19]
-
SPEC: Standard Performance Evaluation Corporation.
SPEC SFS97_R1 V3.0.
www.spec.org/sfs97r1, September 2001.
- [20]
-
Sun Microsystems, Inc.
Chill - remove useful pages from the virtual memory cache.
SunOS 4 Reference Manual, Section 8.
- [21]
-
E. Zadok and J. Nieh.
FiST: A Language for Stackable File Systems.
In Proceedings of the Annual USENIX Technical Conference, pages
55-70, San Diego, CA, June 2000.
Footnotes:
1Appears in the proceedings of the 2005 Annual USENIX Technical Conference, FREENIX Track
File translated from
TEX
by
TTH,
version 3.67.
On 25 Feb 2005, 19:08.